Guest post by Huan Lee, Lambient Technologies
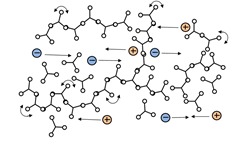 In Part 10 of this series, I defined ion viscosity (IV) as the frequency independent resistivity (ρDC) of a polymer, which correlates with viscosity before gelation and modulus after gelation. For dielectric cure monitoring it is important to understand how to identify ion viscosity and isolate it from other factors.
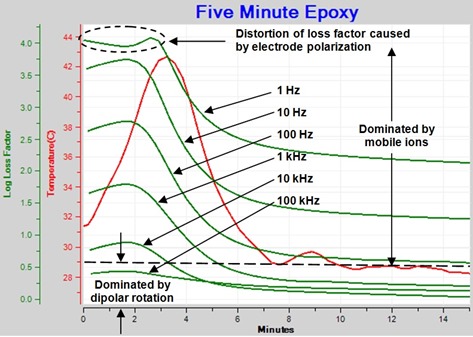
Many in this field are more familiar with loss factor (e”), so it is easiest to begin by looking at the loss factor during cure of a familiar thermoset, in this case “Five-minute” epoxy, shown in Figure 1.
Figure 1. Loss factor for curing epoxy
During early cure, loss factor is inversely proportional to frequency for 10 kHz or less—the effect of mobile ions dominates here. Loss factor for 1 Hz shows distortions characteristic of a boundary layer caused by a phenomenon called electrode polarization. As cure progresses, the relative influence of dipole rotation grows; after a time loss factor is no longer inversely proportional to frequency for 1 kHz or greater. At the end of cure, loss factors for 1 Hz and 10 Hz are still inversely proportional to frequency.
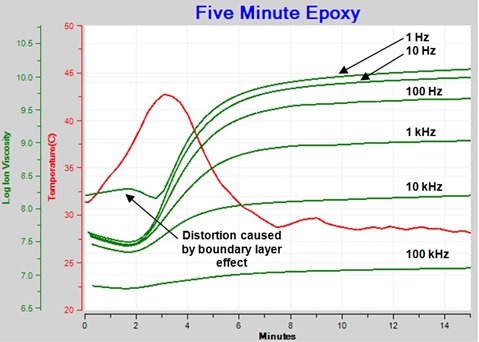
Figure 2 shows resistivity (ρ), defined by equation 1, derived from the loss factor data of Figure 1.
(eq. 1) ρ = 1/(ωe0 e”MUT)
Where: e0 = Permittivity of free space
ω = 2πf (s-1)
f = Frequency (Hz)
Figure 2. Resistivity of curing epoxy plotted (plotted against log (ion viscosity) axis)
Resistivity has both frequency independent (ρDC) and frequency dependent (ρAC) terms. Frequency independent resistivity, from mobile ions, dominates where curves overlap, although sometimes the overlap may not be perfect because of a slightly non-ideal response.
Note that the resistivity of Figure 2 is the sum of both frequency independent and frequency dependent components (ρDC + ρAC). When this total resistivity is unknowingly represented as ion viscosity, misleading interpretations of cure state may result. Which curve is ion viscosity? Which curve follows viscosity? Or Modulus? Therefore it is necessary to correctly identify ion viscosity.
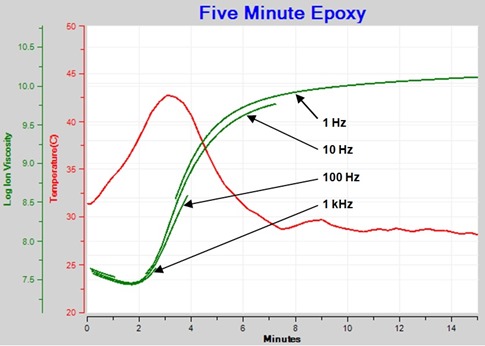
Figure 3 shows the family of resistivity curves after using an algorithm to present only data dominated by mobile ions. This plot now shows the progression of frequency independent resistivity, properly called ion viscosity, that indicates cure state of the material.
Figure 3. Ion Viscosity – frequency independent resistivity component
To determine the time of maximum reaction rate or the time to end of cure, we must calculate the slope of log(ion viscosity), here simply called slope for brevity. Unfortunately, the ion viscosity segments of Figure 3 do not overlap perfectly and would yield a series of discontinuous curves for slope. To avoid this problem, we should calculate slope of ion viscosity from a single frequency, such as from the 10 Hz data of Figure 4. This simplification is possible because ion viscosity from a properly chosen frequency usually is very similar to the composite from multiple frequencies.
Figure 4. Ion Viscosity at 10 Hz frequency
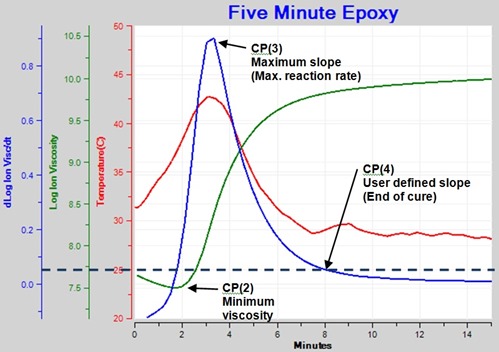
Figure 5 shows ion viscosity from 10 Hz data as well as the resulting curve for slope.
Figure 5. Ion Viscosity and slope for 10 Hz frequency showing the Critical Points.
Four Critical Points, which identify particular events, can characterize the cure of a thermoset:
- Critical Point 1—CP(1)—Onset of flow
- When ion viscosity passes a user defined level
- Used to indicate when material reaches the dielectric sensor
- Critical Point 2—CP(2)—Viscosity minimum
- When ion viscosity reaches a minimum value
- Also approximately the time of minimum mechanical viscosity
- Critical Point 3—CP(3)—Maximum reaction rate
- When slope reaches a maximum value
- Associated with gelation but not indicating gelation
- Reaction rate begins to slow after this time
- Critical Point 4—CP(4)—End of cure
- When slope reaches a user defined level
- Selected level indicates a chosen cure state that depends on the application
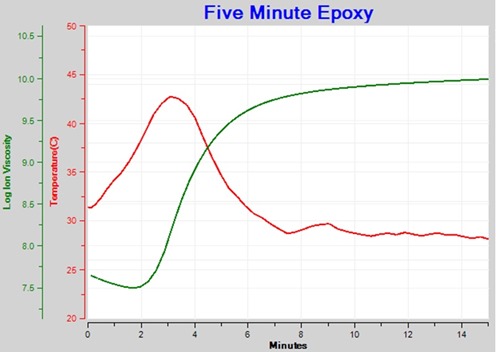
In Figure 5 we can clearly see CP(2), CP(3) and CP(4). The epoxy was applied to the sensor before the start of this test, so the material had already flowed by time t = 0 and CP(1) is not shown.
During thermoset cure, curves of resistivity measured at different frequencies overlap (ideally) when mobile ions dominate the dielectric response. This overlap identifies frequency independent resistivity, also known as ion viscosity. Ion viscosity indicates cure state and Critical Points from the ion viscosity curve can characterize the progress of cure.
In my next post I will write about dielectric sensors and the features of dielectric cure monitoring instruments that are most useful for studying thermosets.
|


Leave a Reply