In the previous several posts three methods were discussed to measure the glass transition temperature:
- Differential Scanning Calorimetry (DSC)
- Thermomechancial Analysis (TMA)
- Dynamic Mechanical Analysis (DMA)
To compare the glass transition temperatures obtained using the three methods above, Tg data from an epoxy-amine system cured for 6 hours at 80oC is presented in the following table:
The conventions used for Tg determination:
- DSC midpoint
- TMA intersection of the two tangents (low and high expansion region)
- DMA conventions are noted in the table.
When reporting a value of the glass transition temperature, care must be taken to document both the measurement method and the conventions used to assign the glass transition temperature (Tg). Note in the table above, the Tg from DSC midpoint, TMA and E’onset from DMA are all very close. The DMA data can be used to determine the width of the glass transition region, which in this case is approximately 20oC. If you have a limited amount of material, for example during screening testing during formulation development, the DSC method provides Tg data with a very small sample (10-30 mg).
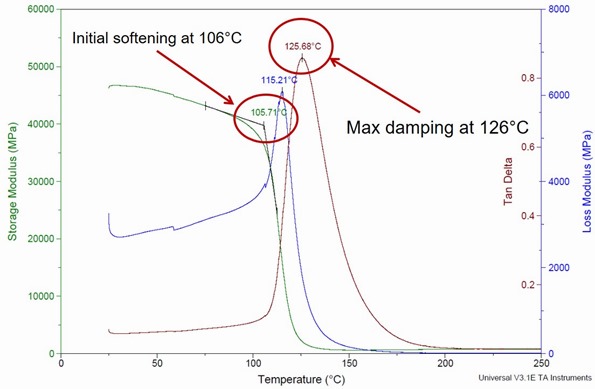
Figure 1. Dynamic Storage and Loss modulus and Tan Delta as a function of temperature for an epoxy amine system cured at 80oC for 6 hours.
Once you have developed the material or need to determine the mechanical properties (such as modulus and coefficient of thermal expansion) in addition to the glass transition temperature, then both TMA and DMA are very powerful techniques. Figure 1 shows the DMA data for an epoxy amine system cured for 6 hours at 80oC. The transition from the glassy region to the rubbery region is well defined at 106oC. The loss modulus peak (E”max) and the tan delta peak are narrow and well defined indicating that the network structure is likely fairly uniform.


Leave a Reply