Guest Post by Huan Lee, Lambient Technologies
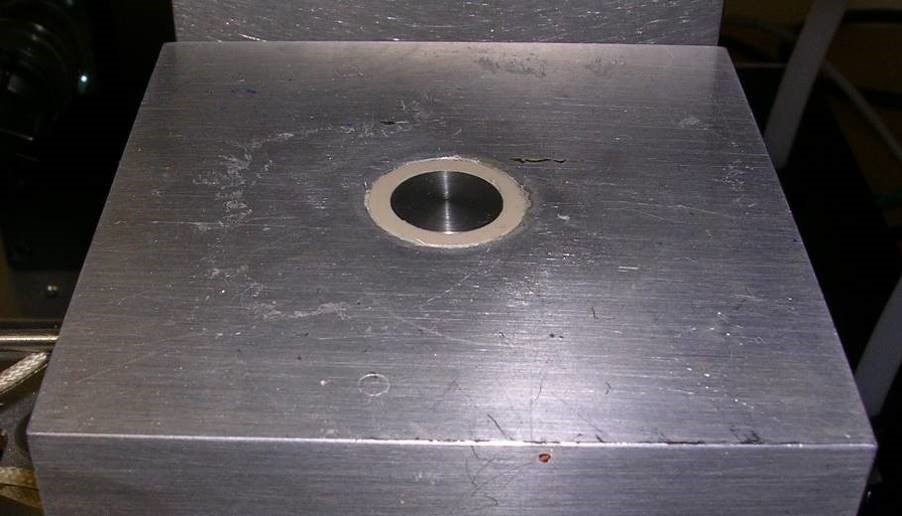
In the first post of this series, we saw in theory how ion viscosity changes as a thermoset cures, and how Critical Points can characterize the cure. Now let’s see how epoxy molding compound cures in reality. Samples of EMC were placed on a Lambient Technologies 1” Unitrode Sensor [Ref. 1], shown in Figure 1, then were compressed and heated in a miniature press to observe cure at 150 °C, 160 °C, 170 °C and 180 °C.
The cure time for EMC can be less than three minutes so an LTF‑631 High Speed Dielectric Cure Monitor [Ref. 2] measured ion viscosity during each test, and used a trigger that initiated data acquisition at a consistent point in the press’s compression cycle.
Figure 1. Unitrode reusable sensor
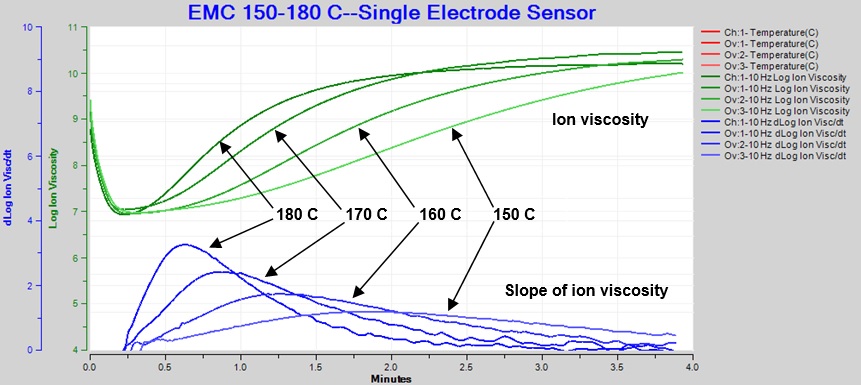
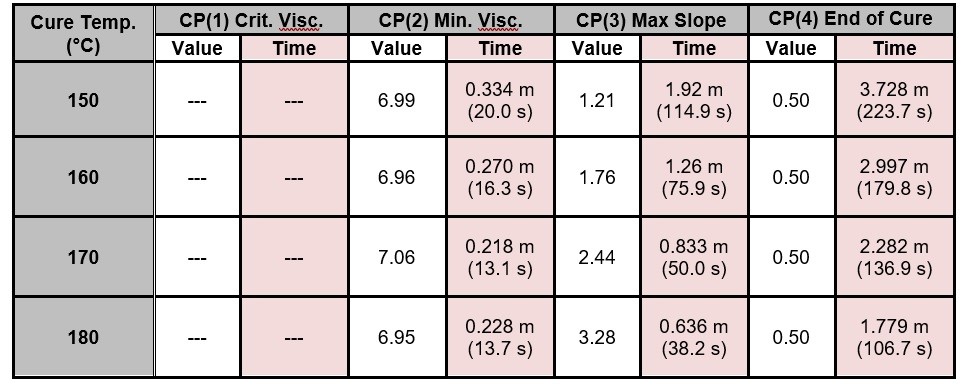
Figure 2 overlays data from the cures at 150 °C, 160 °C, 170 °C and 180 °C, and shows the sensitivity of dielectric cure monitoring (DEA) to changes in cure rate due to temperature differences. As expected for a thermally activated reaction, the ion viscosity curves rise and flatten more quickly with increasing temperature—indicating faster cure and shorter times to end of cure at higher temperatures. Critical Points that characterize each cure are listed in Table 1.
Figure 2. EMC ion viscosity (green) and slope (blue) at 10 Hz, cures at 150 °C, 160 °C, 170 °C and 180 °C
Table 1. Critical Points from EMC cure monitoring
The time to CP(1) indicates onset of flow and is not a measure of cure, so CP(1) data are not shown.
The time to CP(2) is the point when the EMC has the lowest mechanical viscosity and depends largely on how quickly the EMC heats. The time to CP(2) does not significantly reflect the rate of cure, so it is not surprising to see fairly constant times at different temperatures.
The time to CP(3) indicates the moment of fastest reaction. Before CP(3) the reaction is accelerating as temperature increases from the exotherm and external heating. After CP(3) the reaction slows as the network grows and monomers are depleted. Although CP(3) is not the gel point, CP(3) is often used as a signpost associated with the gel point.
The time to CP(4) is the time to a user defined slope indicating end of cure. True end of cure occurs when the reaction stops, the material is no longer changing and the slope is zero. In reality, the reaction may continue very slowly for considerable time, so for practical purposes a small, non-zero slope is usually selected, with a value depending on the needs of the application. For the purposes of these tests, a slope of 0.5 was arbitrarily chosen to define CP(4).
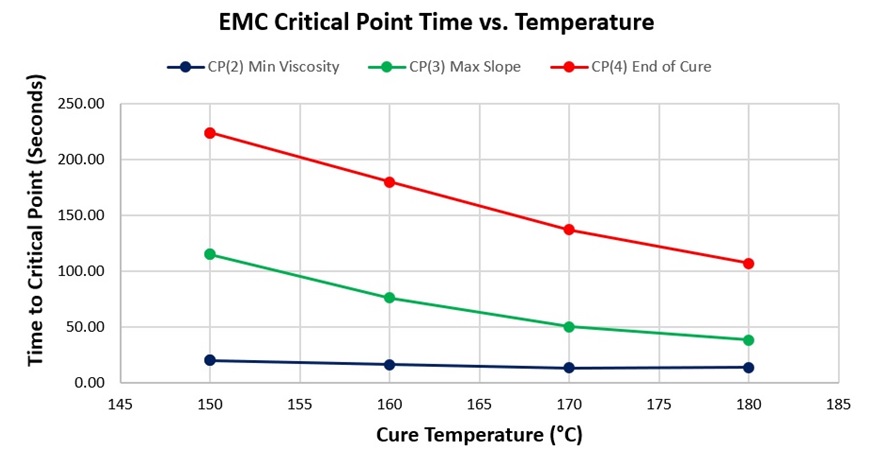
As seen in Figure 3, the times to reach CP(3) and CP(4) decrease as temperature increases, indicating faster cures, which are expected for thermally driven reactions.
Figure 3. Critical Point time vs. cure temperature for BMC
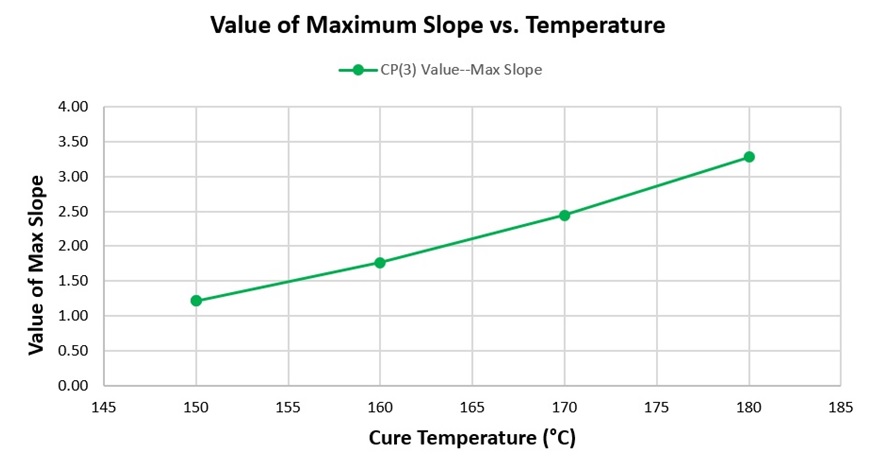
Figure 4 shows how the maximum value of slope increases with temperature. Again, this relationship is expected because the height of CP(3) is a relative measure of the maximum reaction rate, which increases with temperature.
Figure 4. Value of maximum slope vs. cure temperature for EMC
For quality control, the ease of dielectric cure monitoring and the use of Critical Points permits testing every batch of EMC before use, yielding quantitative information about the cure that can be recorded and analyzed statistically. Deviations from normal values of Critical Points indicate problems with the resin—either with the formulation or the process temperature—and provide an early warning of possible problems in manufacturing.
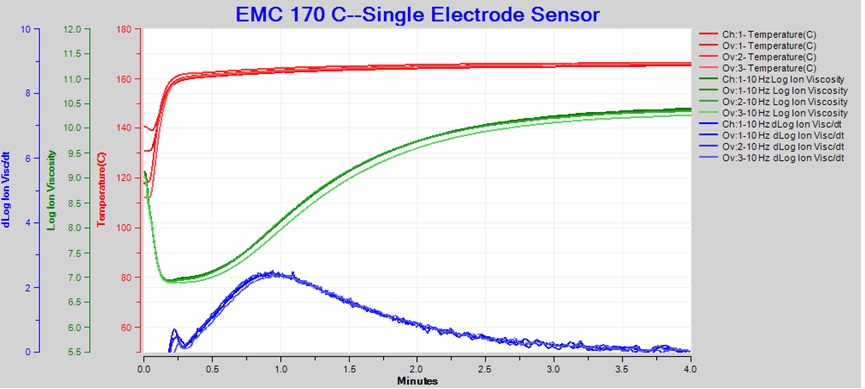
Figure 5 shows data from four consecutive tests of EMC at 170 °C. In this case the ion viscosity curves are virtually indistinguishable from one another, verifying high repeatability. When dielectric cure monitoring is used for quality control of outgoing material, formulators of EMC can assure customers their product has been fully tested for consistency.
Figure 5. Repeatability of EMC cure at 170 °C (four consecutive tests)
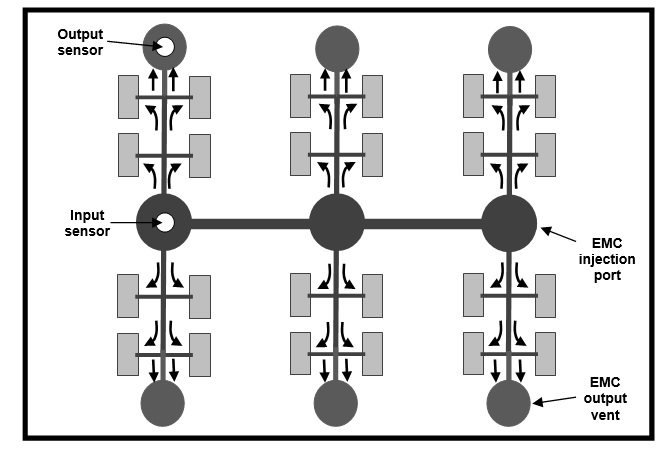
Some electronics manufacturers have installed dielectric sensors in both the input and output ports of a mold, illustrated schematically in Figure 6.
Figure 6. Mold with sensors for EMC cure monitoring
By continuously monitoring the ion viscosity of EMC at both the injection port and output vent, it is possible to understand the behavior of the material between these two points and determine:
- Flow time from input to output
- Variation of minimum viscosity at the mold cavities
- Cure rate at mold cavities
- Cure state at time of demold
These additional parameters provide important information for keeping the packaging process in control. Changes beyond specified limits warn the manufacturing engineer of potential problems with the epoxy molding compound.
References
- 1” Unitrode sensor, manufactured by Lambient Technologies, Cambridge, MA USA https://lambient.com
- LTF-631 High Speed Dielectric Cure Monitor, manufactured by Lambient Technologies, Cambridge, MA USA.


Leave a Reply