Guest Post by Huan Lee, Lambient Technologies
Instead of ion viscosity (electrical resistivity), many users of older cure monitoring equipment measure a material’s conductance and plot the results on a linear scale. Why conductance? Why a linear scale? Because that is an old-school method based on advice from the equipment’s manufacturer. In this post I want to how a linear plot can be misleading and how a logarithmic plot provides the most insight from conductivity or ion viscosity.
During cure the conductance of a thermoset or composite changes by several orders of magnitude. Before processing starts, conductance is normally low because the material is usually solid. Upon heating, the material melts or softens, and conductance increases considerably. Then conductance decreases as cure takes over at the higher temperature. By the end of cure the conductance may have decreased by a factor of 100 or more from its peak.
Figure 1 shows the conductance during cures of several samples from the same batch of sheet molding compound (SMC). The data are plotted against a linear scale and reveal considerable sample to sample variation. In addition, it is impossible to see any detail at the end of cure, when conductance seems to have decreased to zero. At first glance it seems like this batch has poor consistency, but a deeper look will reveal something else.
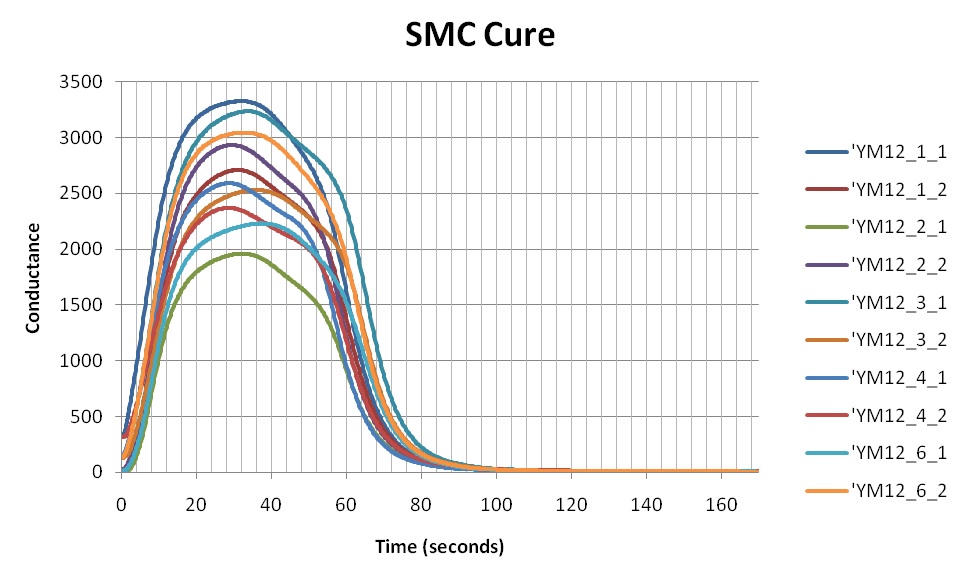
Figure 1. SMC conductance during cure, on a linear scale
Figure 2 shows an electrical model of the conductance and capacitance of a material under test (MUT) between parallel plate electrodes, but only conductance is relevant in this discussion.
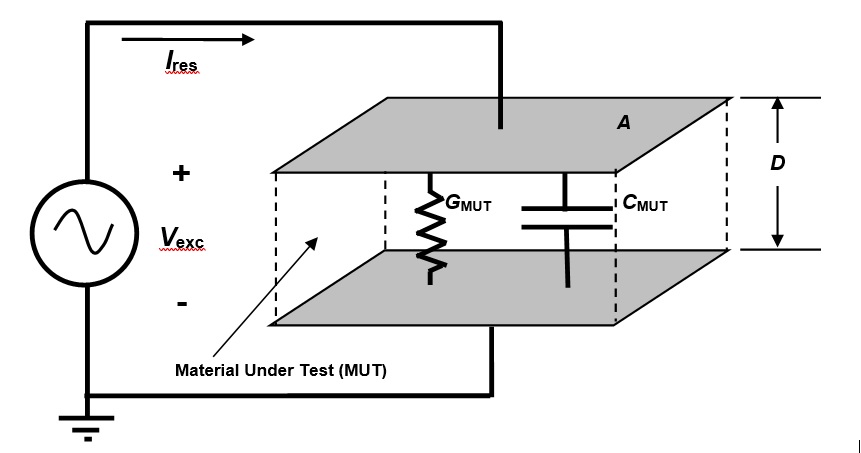
Figure 2. Electrical model of dielectric Material Under Test
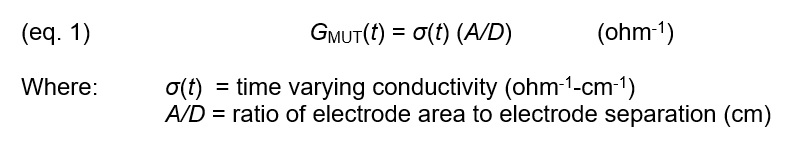
Conductance is a bulk property that depends on the amount of Material Under Test, the geometry of the electrodes and the conductivity of the material between them. During cure this conductance, GMUT(t), which changes with time, is defined by equation 1:
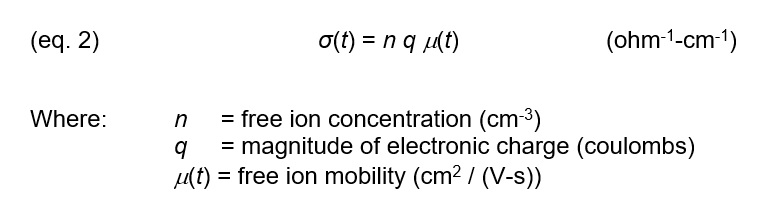
Conductivity is a material property and is given by equation 2:
Combining equations 1 and 2 produces the following expression:
![]()
The terms in brackets— [n (A/D) q] – are generally constant in a particular sample and are unrelated to cure:
- n —Free ion concentration, which increases with conductive additives and decreases with non-conductive filler
- A/D —Electrode geometry, which may differ from sensor to sensor because of variations in fabrication or set up
- q—Free ion charge, which is constant but is included for simplicity
In a thermoset the growing polymer network impedes the flow of ions and reduces their mobility. As a result, only the change in free ion mobility affects conductance. Expressed logarithmically, equation 3 becomes:
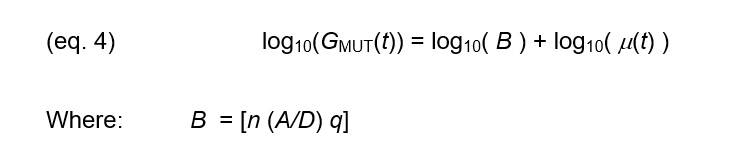
A logarithmic scale captures the entire dynamic range of GMUT(t), which can change by several orders of magnitude during cure. More importantly, a logarithmic scale separates B—the factors unrelated to cure—from ionic mobility. If the free ion concentration and the electrode geometry are constant, then the effect of B is a fixed offset from the baseline cure behavior.
When we replot the data of Figure 1 on a log scale, as shown in Figure 3, we see the curves actually have the same fundamental shape—we are seeing only the behavior of ionic mobility. That is: We are seeing the cure itself.
SMC is a stiff composite of chopped glass fibers mixed with polyester, vinyl ester or epoxy resin, and true uniformity may be difficult to achieve in a large batch. The conductance curves of Figure 3 primarily differ only by a small, constant offset, probably caused by a variation in filler content among samples.
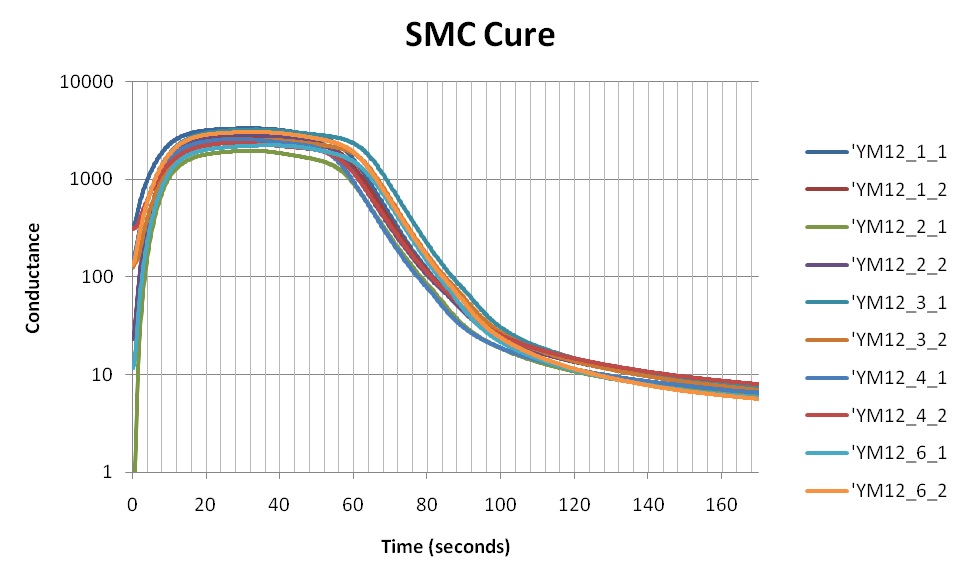
Figure 3. SMC conductance during cure, on a logarithmic scale
Conductance is no longer commonly used to study thermoset cure. Using either resistance—the reciprocal of conductance—or ion viscosity is now more conventional. Figure 4 shows the SMC data represented as resistance on a log scale. These curves are more familiar and intuitive because low resistance corelates with low viscosity and high resistance correlates with high viscosity or high degree of cure.
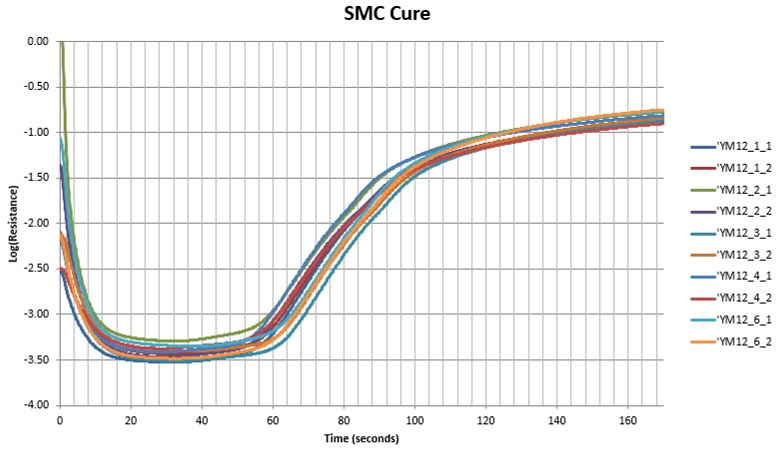
Figure 4. SMC resistance during cure, on a logarithmic scale
Plotting resistance or ion viscosity, derived from resistance, on a logarithmic scale has significant advantages compared to a linear scale:
- The entire dynamic range of cure behavior is visible
- Only factors that affect cure determine the shape of the curve
Factors that do not affect cure, such as variations in filler content or sensor geometry, determine offsets of the curve but not its shape
Consequently, using a logarithmic scale is the optimum method for seeing all the information available from dielectric cure monitoring.

Leave a Reply