 In our last post, the glass transition temperature (Tg) was shown to be a very good indicator of the degree of cure for thermosets. In several posts in this series the use of differential scanning calorimetry (DSC) was presented as an easy and reliable method for measuring Tg at various states of cure. DSC has an advantage in that the experimental method requires very small sample sizes on the order of 10-30 mg. Thus, it is easy to do curing studies on small samples and quickly get Tg data as a function of the cure temperature/time profile. In this post we will examine the use of Thermomechanical Analysis (TMA).
TMA measures the change in sample dimension as a function of temperature for a small sample placed under the expansion probe. In contrast to DSC, the sample size is larger and care must be taken in sample preparation to ensure the top and bottom of the sample are parallel to allow proper seating of the TMA probe on the sample.
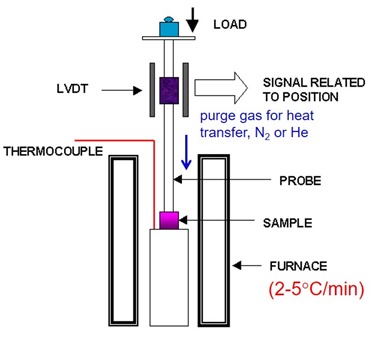
 The figure on the left depicts the TMA in the expansion mode, where the sample (purple) is placed under the probe to measure the dimension changes. The probe has a small load applied to ensure uniform contact with the sample surface. The typical purge gas is nitrogen or helium to enhance heat transfer to the sample. The oven temperature can be precisely controlled. The TMA experiment is fairly simple; monitor the change in sample dimension during a controlled temperature ramp, typically in the range of 2-5oC/min). Using the slower heating rate ensure better temperature uniformity in the sample during the test.
The important parameters measured in a TMA run are the glass transition temperature (Tg) and the coefficient of linear thermal expansion, typically denoted as CTE and calculated from the original sample dimensions and the change in length with temperature:
The units for CTE are either ppm/°C or 10-6 in/in/°C. Now let’s discuss how to measure Tg using the TMA.
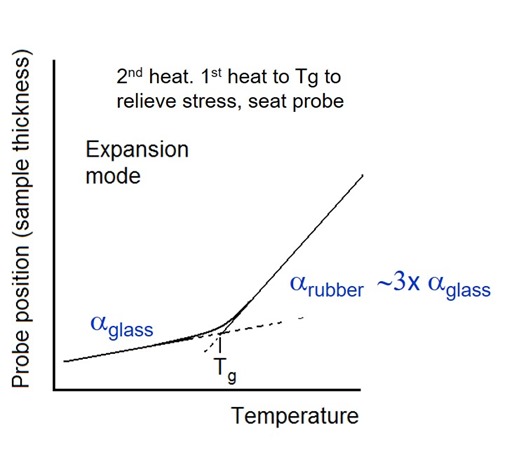
Figure 1. TMA probe position as a function of temperature
In Figure 1 there are two distinct regions of expansion. The lower temperature region is associated with the thermal expansion of the glassy region. There is a transition region where the slope changes to a much higher value in the rubbery region. Note that in the rubbery region the CTE is on the order of three times the CTE of the glassy region. The glass transition temperature can be determined by drawing tangents to the slopes in the glassy and rubbery regions and the intersection is defined as the Tg as shown in Figure 1. If your end use application is sensitive to a change in mechanical properties, then TMA is the preferred method to measure Tg. As can be seen in Figure 1, the glass transition occurs over a temperature range the the intersection of the tangents used as the convention to determine the glass transition temperature. The curve in Figure 1 above is also the second heat. The first temperature ramp is typically taken up to just about where the Tg will occur in order to relieve stress from the sample preparation and seat the probe. If you are using TMA to follow the curing, use caution not to heat the TMA sample far above Tg so you don’t induce further chemical reaction. Note the first heating to just above Tg is similar to the technique described in a previous post to eliminate the enthalpy relaxation peak in a DSC experiment.
While not as common as the expansion probe method, the softening point (which occurs near the Tg) may be measured using the TMA in penetration mode.
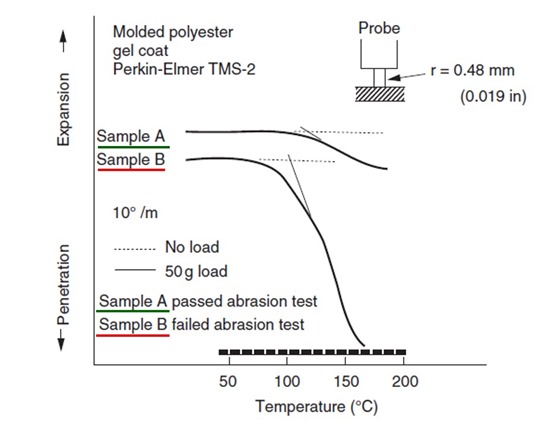
Figure 2. TMA penetration as a function of temperature for a polyester gel coat.
In Figure 2, the TMA was used to determine the softening temperature for two gel coat samples. In this case, the penetration mode probe geometry is slightly different with a smaller diameter tip used in contact with the sample. Additionally, experiments need to be conducted to determine the proper amount of preload required to get a good TMA penetration signal. In Figure 2, the dashed lines indicate a run with no preload. The solid line shows the penetration profile using 50 grams of load. From the two TMA profiles in Figure 2, sample B has a lower softening temperature compared with sample A. Sample B could potentially be less cured compared with sample A. In this case, sample B failed an abrasion test and sample A passed, so the likely interpretation was sample B was under cured and thus has inferior mechanical resistance to abrasion. Figure 2 shows clear differences in the softening points and when used in careful curing experiments or in this case an abrasion test, the TMA penetration method provides nice insights into the curing process.
The next post will cover measurement of Tg using Dynamic Mechanical Analysis (DMA).


Leave a Reply