Previous nine posts covered many of the mechanical aspects of dispersing fillers into thermoset resins. The final post in this series will cover measuring the mixing effectiveness using the fineness of grind or the Hegman gage. The Hegman gage is commonly used as a quality control test at the end of a mixing process. A small amount of material is required and can be obtained from the mixing vessel prior to discharge. Typically, after mixing a 10 cc syringe is used to take enough samples to run three replicates.
The standard test method is covered in ASTM D1210-05 “Fineness of Dispersion of Pigment-Vehicle Systems by Hegman-Type Gage. There are multiple suppliers who sell the drawdown gage and scraper as shown in Figure 1. I have used gages from BYK-Gardner [1] and they are available in multiple particle size ranges.
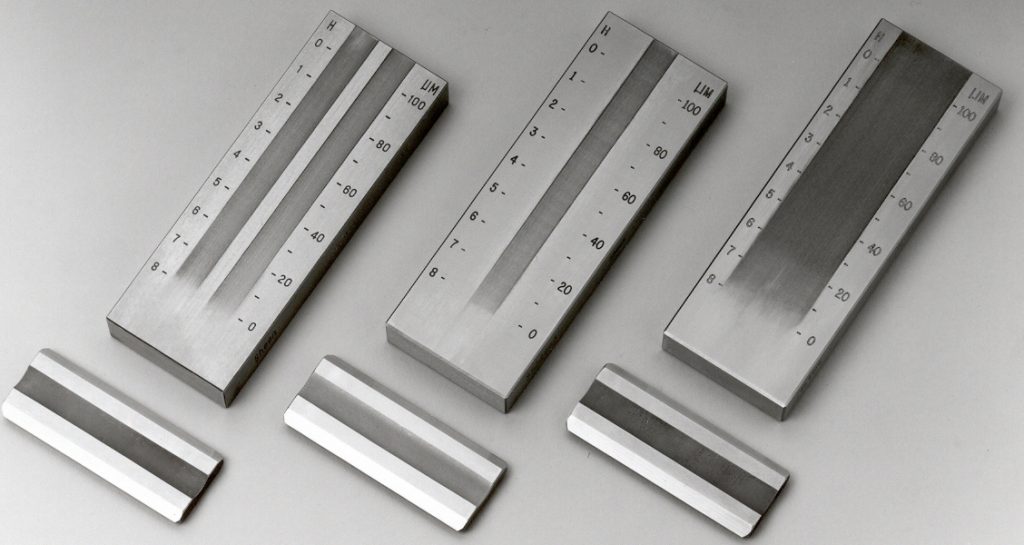
Figure 1. Various configurations for the Hegman or fineness of grind gage.
A very common gage is shown in the left in Figure 1. On the stainless steel grind block there are two tracks, one with the Hegman rating from 0-8 and one showing the micron rating from 0 – 100 µm. The fineness of grind is reported in both units. Each grind gage comes with a specially designed stainless steel scraper as seen below each gage.
The sample to be tested is placed across the channels in the stainless steel block on the deep end of the track (0 on the Hegman scale and 100 µm on the micron scale). As mentioned above, it is advisable to use a syringe to obtain a sample from the mixing vessel and measure the fineness of grind before emptying the mixing vessel. If the fineness of grind is not in the desired range, additional mixing can easily be performed and the fineness of grind re-measured. Once the sample is placed across the track, the material is drawn down by a steel bar scraper. Holding the scraper in both hands in a nearly vertical, but slightly inclined towards the operator, draw the material towards the shallow end of the tracks using a uniform motion taking about 3 seconds to traverse the gage length. Use care to apply uniform pressure so the scraper makes good contact on the top surface for the gage. After the drawdown, the material should only be in the track(s) and the top gage surface along the sides of the track(s) should be clean. At the end of the drawdown, lift the scraper and quickly looks across the track(s) to see the where particles are visible or one can start to see streaks caused by particles being dragged. See ASTM D 1210-5 for details on how to read the gage and determine the particle sizes.
One should note that the Hegman rating may not be indicative of the actual particle size. If the primary particles are agglomerated (flocculated), the Hegman will measure the size of the agglomerate, since the agglomerate will cause the scratch or particle to be visible after the drawdown. As the scraper blade moves down the gage, the track thickness decreases and particles will either become visible or the blade motion will cause streaks as the scraper blade pulls the particle through the mixture.
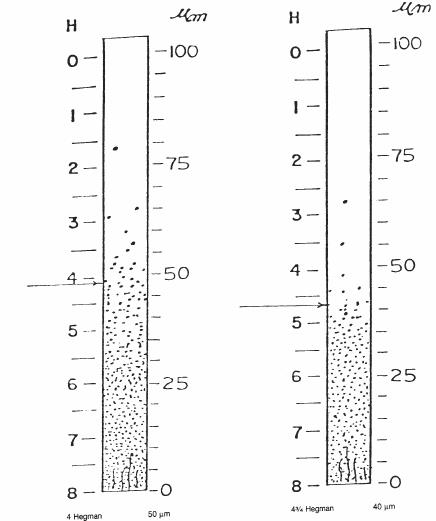
Figure 2. Typical Fineness of Grind gage patterns (from ASTM D 1210-05)
When reading the gage after the drawdown, there are two conventions; one is the scan the tracks from the deep end to the shallow end, or the second is to scan the tracks from the shallow end to the deep end. According to ASTM D 1210-05, the preferred method is to scan from the shallow end to the deep end, allowing the operator to determine when the dense pattern finishes. In Figure 2, the arrows indicate where the main particle patterns finish. Note that the fineness of grind is measured when the dense pattern ends (see the arrows in Figure 2). Record the average of the two if using a two-track gage. Depending on the specific measurement protocol, measure the fineness of grind in at least two drawdowns and record. Some QC protocols call for the average particle size and the maximum particle size (first scratch scanning down from the deep end) to be recorded.
The following video provides a nice description of the Fineness of Grind test procedure.
References
Next week will start a series of guest posts by Huan Lee of Lambient Technologies on recent advances in dielectric cure monitoring.


There is an automated system that can perform the draw-down, scan and rate images called TIDAS. This is produced by Labman Automation.
https://www.labmanautomation.com/tidas-automated-grindometer/