Guest Post by Huan Lee, Lambient Technologies
I’d like to conclude this series by highlighting the unique ability of dielectric cure monitoring (DEA) to measure cure in real-time, which is valuable for studying materials that polymerize in seconds. In this last post I test Quad-CureTM 1933, a glass-metal bonder manufactured by Incure, Inc. [Ref. 1]. Quad-CureTM 1933 is a urethane acrylate that may be cured with UV, visible, LED light and heat, and exhibits dynamic behavior that would be difficult or impossible to see with differential scanning calorimetry (DSC), the conventional method of measuring cure state.
I used the SunSpot 2 UV/Visible Light Curing System from Uvitron [Ref. 2]. The output from its arc lamp is wide-band and intensity at the end of the light guide is typically >18,000 mW/cm2 in UVA (320-390 nm), adjustable from 25% to 100%.
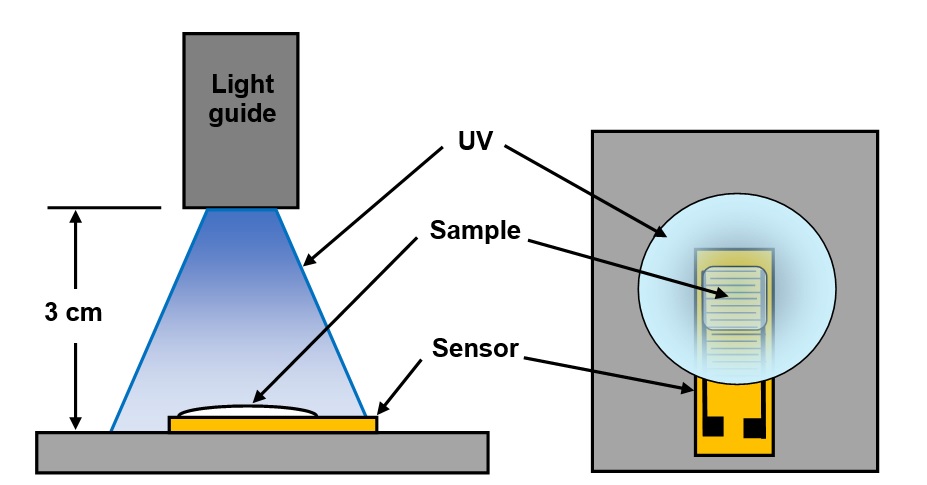
As natural consequence of the optics, light intensity varied radially across the projected spot and uniform illumination was only possible with a small area. Consequently, I applied resin on half of a dielectric sensor [Ref. 3], resulting in a sample approximately 7 mm x 10 mm. The set-up is shown in Figure 1.
Figure 1. Test setup for UV cure
The SunSpot 2 uses both a dichroic filter and mirror to nearly eliminate IR transmission through the light guide. Absorption of high intensity radiation in the remaining visible/UVA/UVB/UVC wavelengths nevertheless produces considerable heating which can degrade a sample during long exposures.
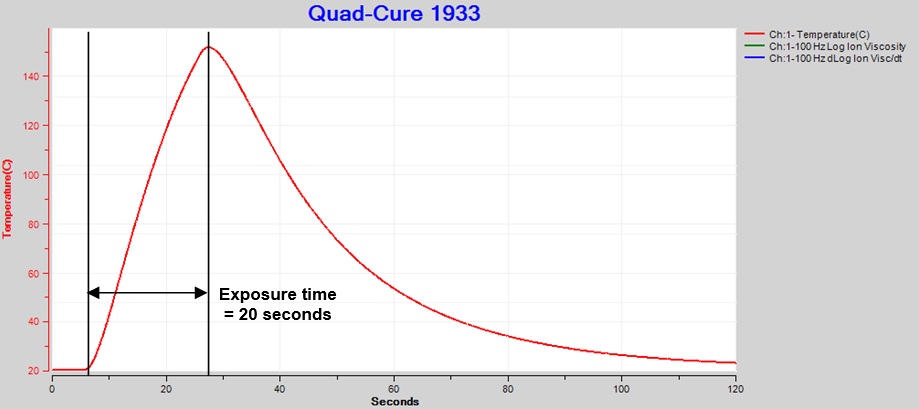
I used a thermocouple to measure temperature at the center of the light spot for an exposure of 20 seconds at 60% intensity. Peak temperature as shown in Figure 2 was just over 150 °C. To avoid material damage, Incure recommends temperatures do not exceed 120°C.
Figure 2. Thermocouple temperature, exposure intensity = 60%, time = 20 sec.
A high-speed dielectric cure monitor measured ion viscosity at a rate of 50 ms/data point. For the first test I used the same irradiation at 60% intensity for 20 seconds to observe the effects of severe over-exposure.
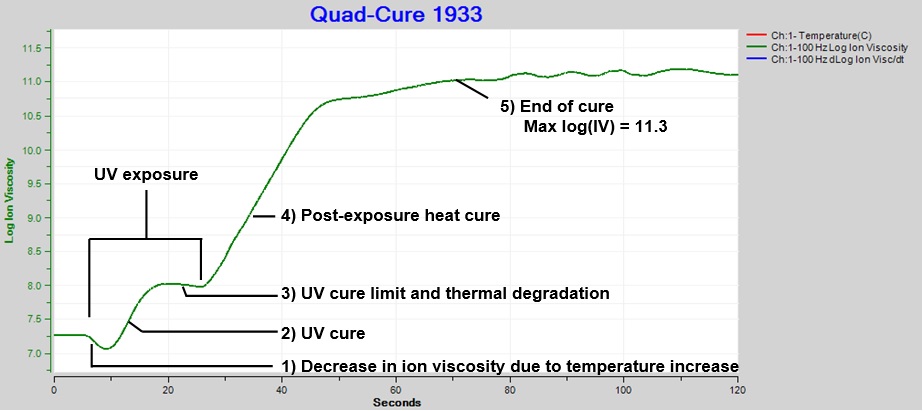
Figure 3 shows ion viscosity data with five distinct events:
- Initial decrease in ion viscosity due to temperature increase
- UV cure
- Cure plateau
- Post-exposure heat cure
- End of cure
Cure reached a limit or plateau between ~17 and 27 seconds, possibly from an equilibrium between UV polymerization and UV breakdown of bonds, confirmed as plausible by an Incure technical representative. The decrease in ion viscosity is characteristic of increased conductivity from thermal degradation.
Figure 3. Ion viscosity of Quad-CureTM 1933, exposure intensity = 60%, time = 20 sec.
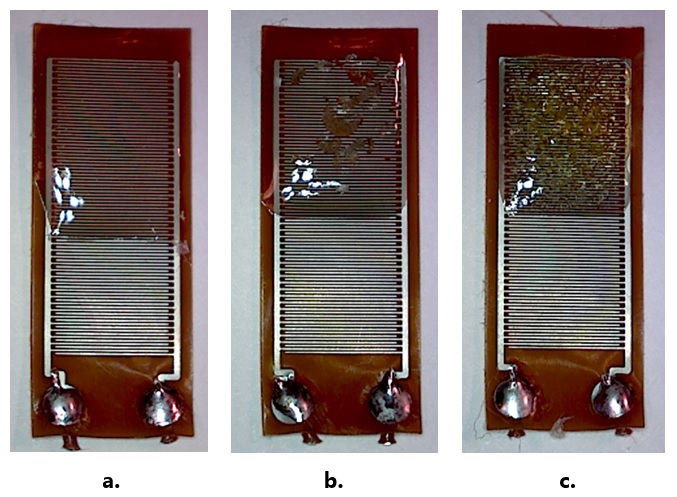
Figure 4 shows a) correct exposure, b) slight over-exposure and c) significant over-exposure.
Figure 4. Correctly exposed (a), slightly (b) and significantly (c) over-exposed samples
As a result of over-exposure, excessive UV energy causes yellowing of the material and excessive heat creates bubbles and brittleness. The sample of this first test was significantly over-exposed and looked like Figure 4.c.
After UV exposure ended, the activated photoinitiators persisted and accelerated polymerization driven by heat. This post-exposure, or “dark,” cure continued for nearly 70 seconds.
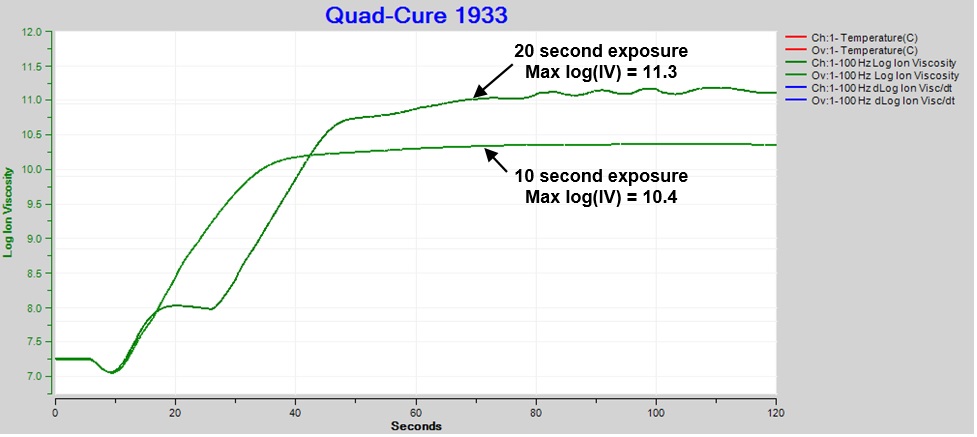
Clearly thermal damage is undesirable, and the irradiation should be adjusted to avoid the ion viscosity plateau. Figure 5 compares cure with 10 and 20 second exposures at 60% intensity. Even though 10 second irradiation eliminated the plateau, the result still exhibited bubbling from excessive heat, like Figure 3.c., indicating over-exposure and degradation.
Final ion viscosity after 10 seconds of UV illumination was significantly less than after 20 seconds. In earlier posts I discussed the relationship between degree of cure and ion viscosity. Here we see the shorter exposure, which would have produced fewer activated photoinitiators and therefore less cure, directly resulted in a decreased maximum ion viscosity.
Figure 5. Comparison: Ion viscosity of Quad-Cure 1933, exposure intensity = 60%, time = 10 sec. and 20 sec.
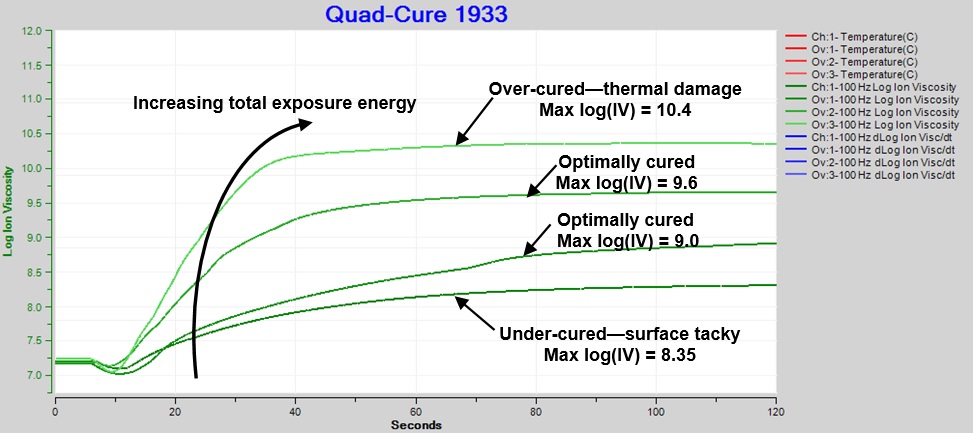
Figure 6 shows increasing exposure energy causes faster cure and higher ion viscosity at end of cure. With all other factors being the same, higher ion viscosity correlates with greater degree of cure. Note that each curve represents the response from a single exposure, and heat from the high intensity light was the source of damage.
Optimum cure, which produces a “sleek” surface without damage, corresponds to log(IV) between ~9.0 and ~9.6. Values of log(IV) < ~9 are associated with surface tackiness and indicate under-cure. Values of log(IV) > ~10 accompany brittleness and thermal damage and indicate over-cure.
Figure 6. Comparison: Ion viscosity of Quad-CureTM 1933, various exposures and total energies
Instead of a single high-intensity exposure, multiple low-intensity exposures can drive cure without excessive heating. In this case, how would the relationship change between ion viscosity and final material state? For quickly reacting resins like those used in UV curing, the value of dielectric cure monitoring lies in its ability to gather real-time information, answering questions like this in ways not possible with other methods.
References:
- Incure, Inc., 1 Hartford Square, Box 16 West, Suite C-3, New Britain, CT, www.uv-incure.com
- Uvitron International, Inc., 150 Front St, Unit 4, West Springfield, MA, www.uvitron.com
- Lambient Technologies, Quarto-Varicon dielectric/conductivity sensor
For further information about dielectric cure monitoring, please contact Lambient Technologies.


Leave a Reply