Guest Post by Huan Lee, Lambient Technologies
The dielectric response of thermosets and resins depends on a number of factors that vary with frequency, so it is important to select an optimum frequency for dielectric cure monitoring (DEA). To inform this choice, we must look at the material property most directly related to cure state, which is frequency independent resistivity—also known as ion viscosity—defined as follows:
- Frequency independent resistivity (ion viscosity) – thermoset resistivity that is constant or nearly constant across a range of AC frequencies and measured without a DC bias
Recent research confirms measurement without a DC bias is necessary to avoid electrochemical effects that confound the data. We will examine these phenomena in the next post.
Now let’s look at the example of PR 520N [Ref. 1], a pre-mixed epoxy system engineered for resin transfer molding (RTM). At room temperature PR 520N is a thick off-white paste and the manufacturer specifies full cure after two hours at 179 °C. For our test PR 520N was applied to a Mini-Varicon [Ref. 2] sensor like that shown in Figure 1, and an LT‑451 Dielectric Cure Monitor [Ref. 3] measured dielectric properties at multiple frequencies while the sample was heated to 180 °C.
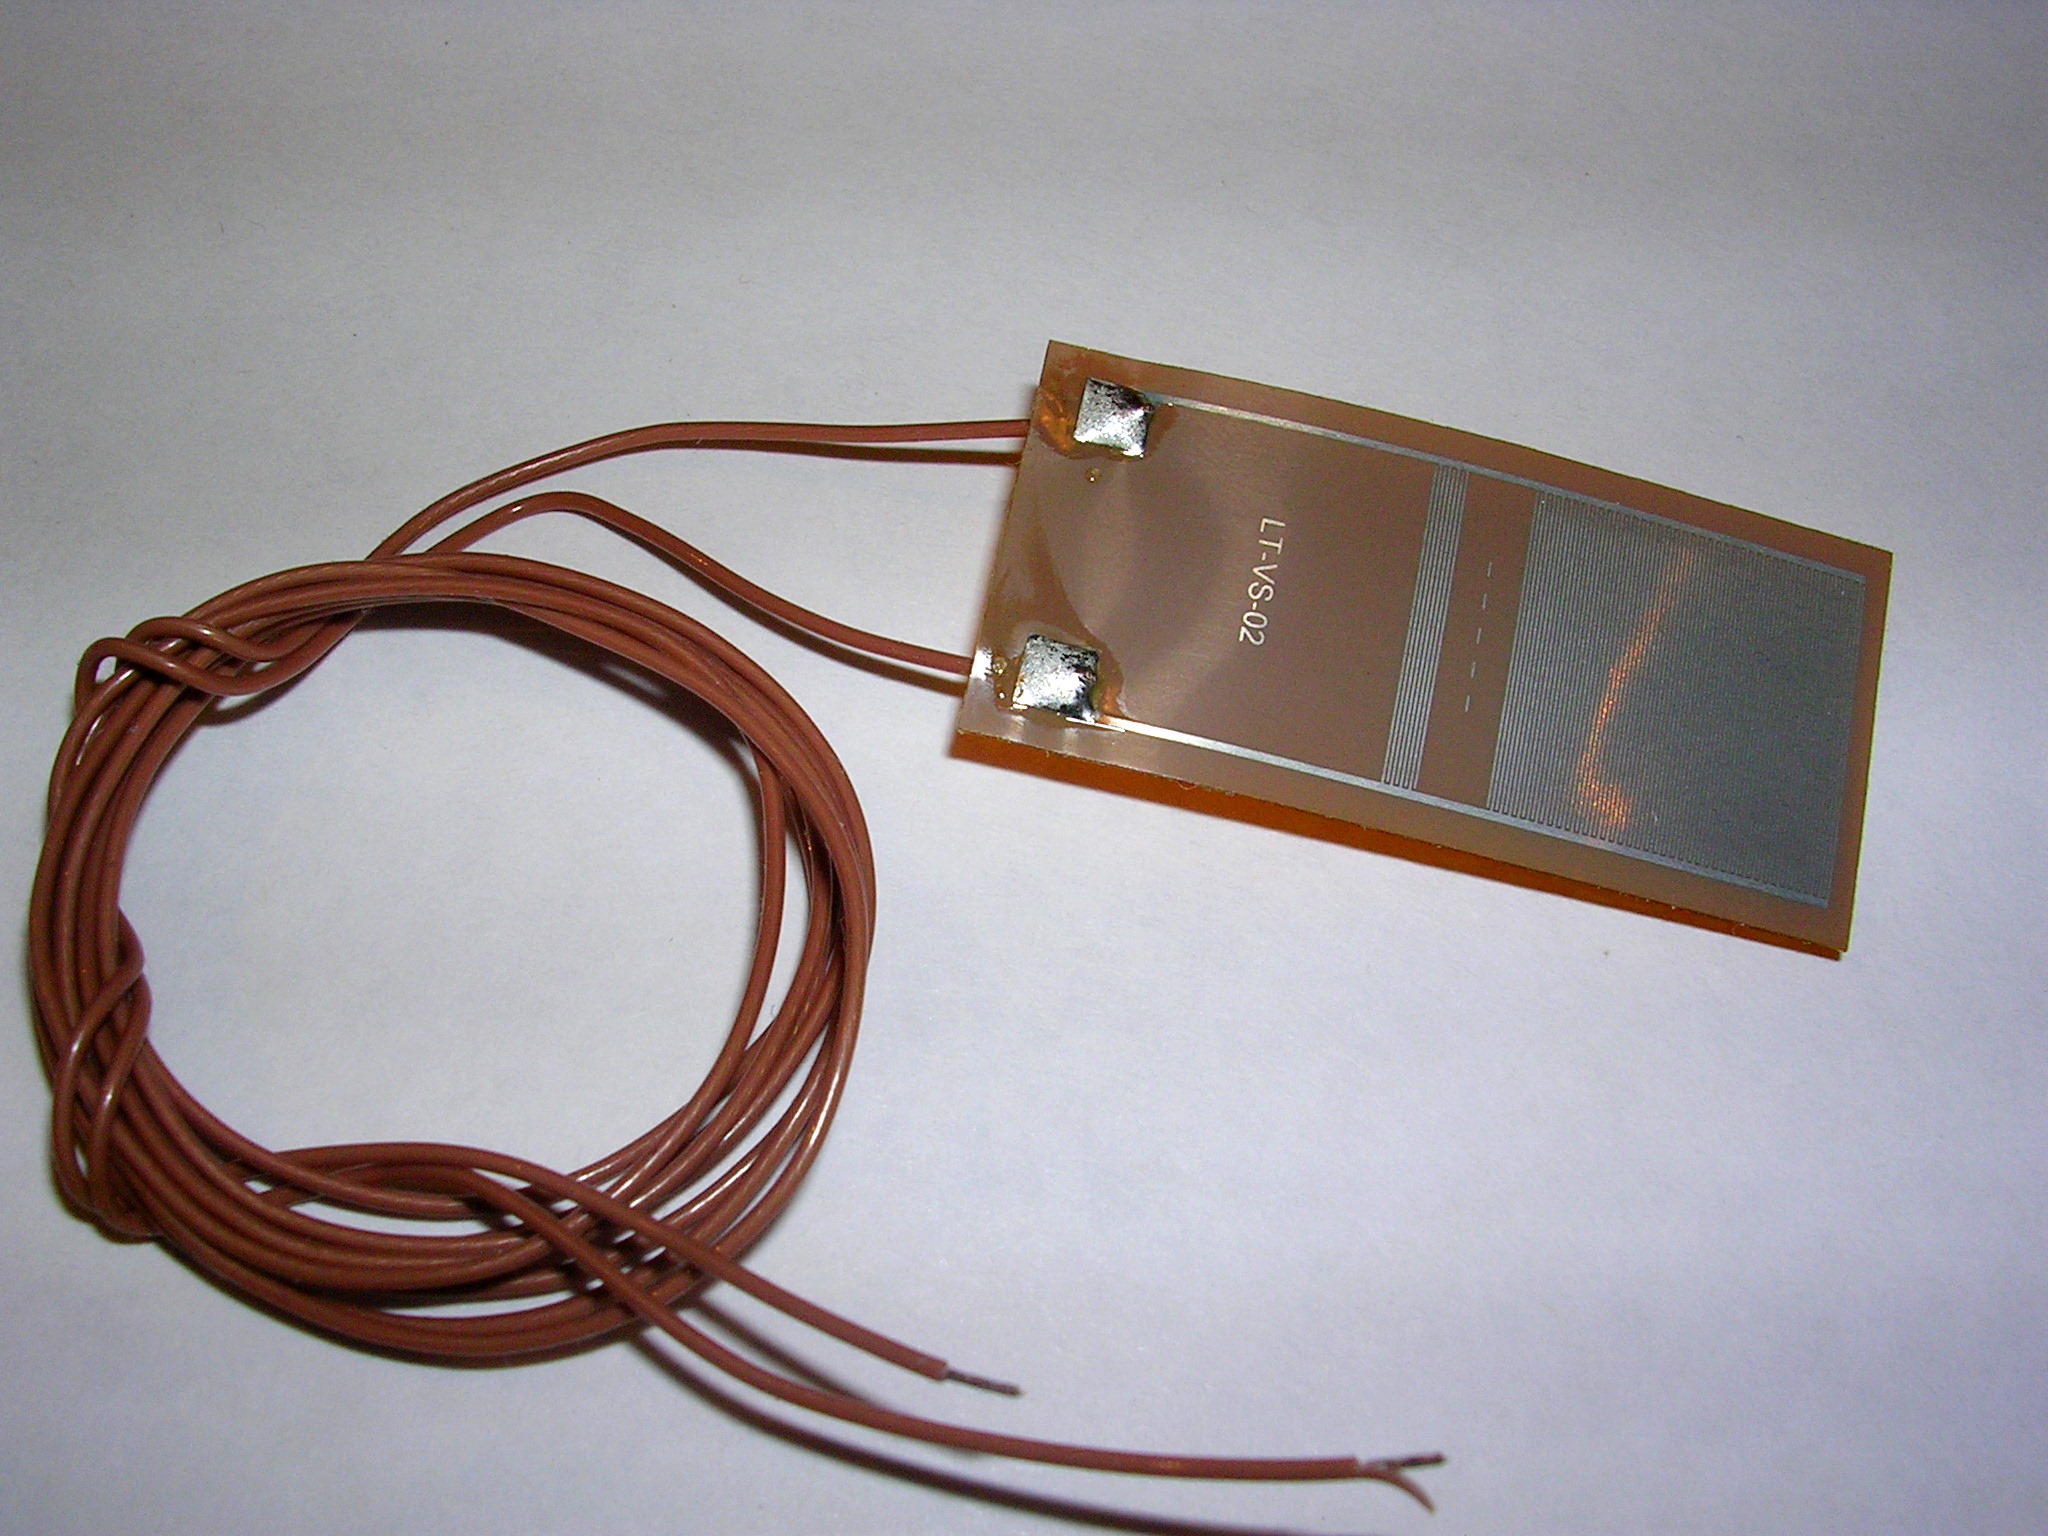
Figure 1. Mini-Varicon dielectric cure sensor
Figure 2 is a plot of the AC resistivity of PR 520N during isothermal cure at 180 °C. Although the data have both frequency independent and frequency dependent components, for convenience all are plotted against an axis labeled ion viscosity.

Figure 2. AC resistivity of PR 520N during isothermal cure at 180 °C
Three features are apparent in Figure 2:
- Distortion of 1 Hz curve during early cure, from 0 to 15 minutes, due to electrode polarization and the resulting boundary layer capacitance [Ref. 4]
- Curves that overlap or nearly overlap, indicating the dominance of frequency independent resistivity
- Caused by flow of mobile ions—true ion viscosity
- Before gelation, change of frequency independent resistivity is often proportional to change of viscosity
- After gelation, change of frequency independent resistivity is often proportional to change of modulus
- Curves that diverge, indicating the dominance of frequency dependent resistivity
- Caused by rotation of dipoles
- For certain frequencies, does not correlate well with cure state
After cure analysis software removed the frequency dependent resistivity, only frequency independent resistivity remains, as shown in Figure 3. These data can now properly be called ion viscosity and accurately follow cure state for the entire test.
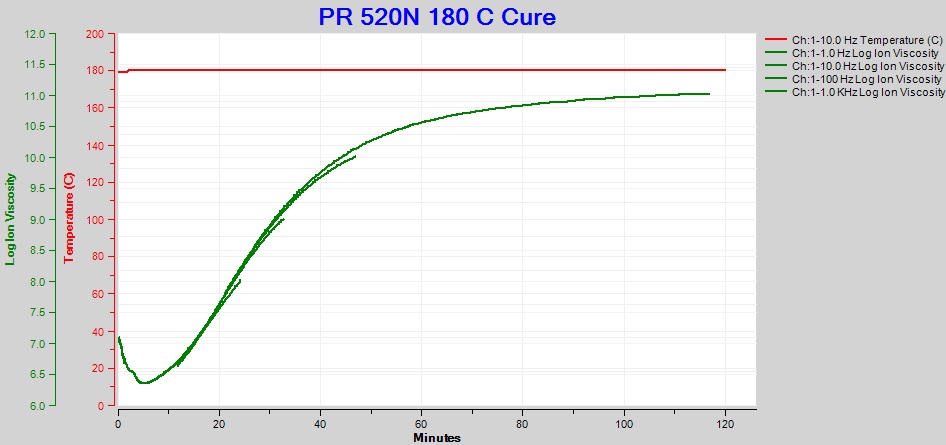
Figure 3. Ion viscosity of PR 520N, with composite of frequencies, for cure of PR 520N at 180 °C
The ion viscosity of Figure 3 is a composite of frequencies from 1 Hz to 1 kHz. Valuable information, such as the time of maximum reaction rate or the time to end of cure, is available from the slope of log(ion viscosity), often called slope for brevity. Unfortunately, the ion viscosity segments of Figure 3 do not overlap perfectly and would yield a confusing series of discontinuous curves for slope.
To avoid this problem, we can calculate slope from a single frequency; and, fortunately, the data from only one frequency is often sufficient. Indeed, we see from Figure 2 the 10 Hz data closely follows the overall composite ion viscosity and avoids the distortion caused by electrode polarization—in this case 10 Hz would be the optimum frequency for cure monitoring. The resulting ion viscosity and slope are plotted in Figure 4.
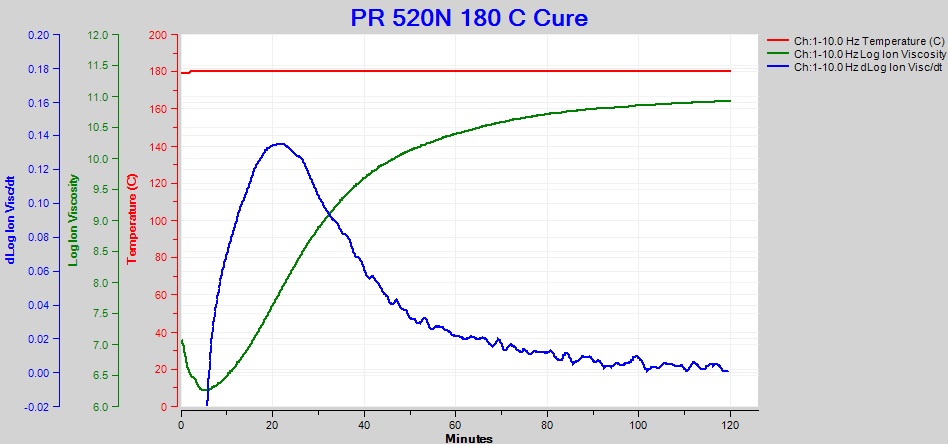
Figure 4. Ion viscosity (green) and slope (blue) of PR 520N at 10 Hz, for cure of PR 520N at 180 °C
At about 120 minutes, the 10 Hz ion viscosity curve approaches a constant value and the slope approaches zero, indicating the reaction is slowing and cure is ending. This behavior agrees with the manufacturer’s specifications of full cure after two hours at 179 °C.
The higher frequency curves of Figure 2, however, follow only early cure and flatten significantly before 120 minutes—after various points, depending on frequency, they no longer correlate with cure state. In the extreme case, the 10 kHz curve incorrectly suggests cure ends after only 30 minutes!
With this understanding of ion viscosity and its correlation with cure state, we can make the following guidelines for frequency selection, adjusting for the slightly different goals and instrument capabilities of different applications:
Research and Development
- Goal is accurate correlation of ion viscosity with cure
- Instruments for R&D usually can measure with multiple frequencies and have a wide frequency range
- If cure time permits, measure with multiple frequencies (e.g. 1 Hz, 10 Hz, 100 Hz, 1 kHz, 10 kHz) for best overview about material behavior and optimum frequency
- If possible, use boundary layer correction [Ref. 4] to fix distortion caused by electrode polarization
- Use the lowest practical frequency that avoids distortion caused by electrode polarization
Quality Assurance/Quality Control or Manufacturing
- Goal is repeatable correlation of ion viscosity or AC resistivity with cure
- Instruments for QA/QC or manufacturing usually measure with a single frequency and have a limited frequency range
- Use the lowest practical frequency that avoids distortion caused by electrode polarization
Do you have a new material to test and don’t know where to start? Try 10 Hz or 100 Hz. Interestingly, these two frequencies are optimum for the cure monitoring of the majority of thermosets and composites—especially widely used materials like sheet molding compound (SMC), bulk molding compound (BMC), epoxy molding compound (EMC), prepregs and UV-cured resins.
Occasionally, a material with very low conductivity would need 1 Hz; and infrequently a very conductive material would need 1 kHz or higher. So start with 10 Hz or 100 Hz and choose a higher or lower frequency based on your results.
References
- Cycom PR 520N RTM manufactured by Solvay, Brussels, Belgium
- Mini-Varicon sensor, manufactured by Lambient Technologies, Cambridge, MA USA. https://lambient.com
- LT-451 Dielectric Cure Monitor, manufactured by Lambient Technologies, Cambridge, MA USA
- D.R. Day, J. Lewis, H.L Lee, S.D. Senturia, “The Role of Boundary Layer Capacitance at Blocking Electrodes in the Interpretation of Dielectric Cure Data in Adhesives,” Journal of Adhesion, 1985, vol.18, p.73.

Leave a Reply