Guest Post by Huan Lee, Lambient Technologies
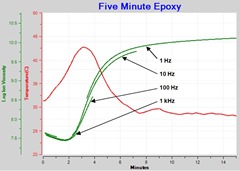 Dielectric cure monitors measure the dielectric properties of material at a single frequency or across a range of frequencies, selectively revealing the influence of mobile ions and dipole rotation. As we saw in previous posts, ion viscosity is frequency independent resistivity (rDC) and is often proportional to mechanical viscosity before gelation and proportional to modulus after gelation. Consequently, ion viscosity is a useful probe of material state through the entire cure.
AC vs. DC Measurements
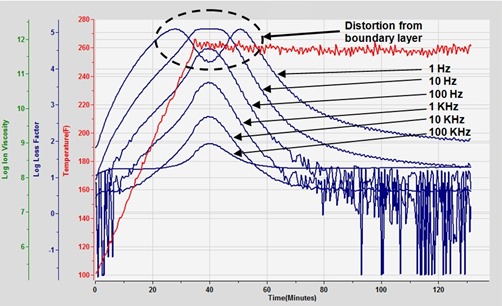
Interestingly, it is often not useful to measure rDC using DC signals. The phenomenon of electrode polarization can create a blocking layer across sensor electrodes during early cure, when material is most conductive. This blocking layer acts like a capacitor and prevents the passage of DC current. In the presence of electrode polarization, dielectric data from very low excitation frequencies are distorted, as shown in Figure 1 for the cure of a graphite-epoxy prepreg.
Figure 1. Distortion in loss factor from a blocking layer
Note the flattening of the loss peak at 10 Hz and the dip in place of the loss peak at 1 Hz. This distortion becomes worse at lower and lower frequencies, and with DC signals a conductive material can even appear non-conductive.
Besides avoiding distorted data from blocking layers, AC signals can also make measurements through a release film, which is a very thin layer of material used to prevent material from adhering to a mold or platen.
AC signals have significant advantages over DC signals, but what frequencies are best for dielectric cure monitoring? Extremely low frequency data require long acquisition times and are subject to distortion from electrode polarization. For most thermosets 1 Hz to 10 Hz is a reasonable lower limit. High frequency data tends to be dominated by dipolar rotation, which masks ion viscosity at the end of cure. For most thermosets 10 kHz to 100 kHz is a good upper frequency limit that still allows studies of dipole response.
LCR Meters and Four-Wire Connections
Many researchers have made their own dielectric cure monitors with LCR (Inductance-Capacitance-Resistance) meters, which measure resistance and capacitance across a range of frequencies. Typical LCR meters use a four-wire, or Kelvin, connection to eliminate the effect of cable resistances. Four-wire measurements increase accuracy for low resistances, on the order of 10 Ω or less. However, the resistances encountered with a typical sensor during thermoset cure are on the order of 10,000 Ω or more. As a result, for dielectric cure monitoring, a simpler two-wire connection may replace the cumbersome four-wire connection without loss of accuracy.
Temperature Measurements
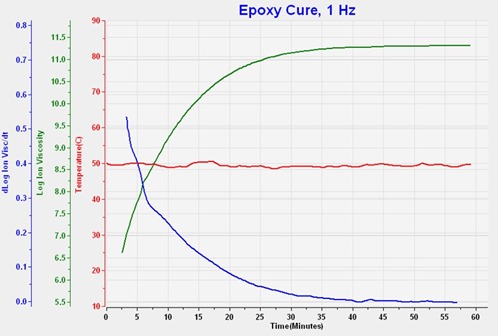
Temperature measurement, usually with a thermocouple, is the other essential function needed for a dielectric cure monitor. At a given cure state, ion viscosity decreases as temperature increases. Knowing temperature provides additional insight into the nature of the cure and can avoid misinterpretation of data. Figure 2 shows the isothermal cure of an epoxy, in which the minimum ion viscosity occurs at time t = 0 and ion viscosity increases monotonically during cure.
Figure 2. Isothermal epoxy cure at 50°C
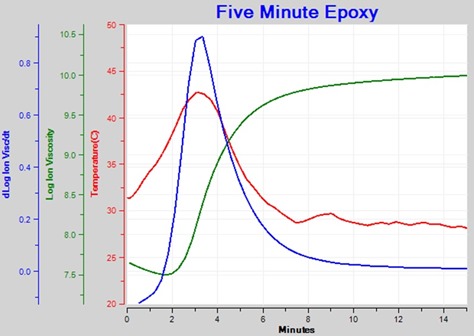
In contrast, Figure 3 shows the cure of a “five-minute” epoxy, which produces an exotherm. Here temperature initially increases as curing begins, liberating heat and resulting in a decrease in ion viscosity. Eventually the reaction dominates, ion viscosity goes through a minimum then increases. Notice also how the peak exotherm occurs at the same time as the maximum slope of ion viscosity—identifying the point of maximum reaction rate. Temperature data is valuable to understanding how a material cures, and is necessary when developing a process or formulation.
Figure 3. “Five-minute” epoxy cure with exotherm
A Dielectric Cure Monitoring System
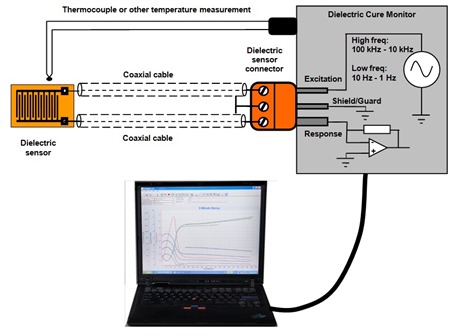
Figure 4 shows the essential elements of a dielectric cure monitor. The most versatile instruments use AC signals for measurement, with a wide excitation frequency range to allow selection of an optimal frequency for observing ion viscosity. Furthermore, multiple frequencies allow the user to study dipolar response.
Temperature measurement is important for understanding cure, especially under non-isothermal conditions.
Finally, software controls the instrument, usually through a computer connected to the dielectric cure monitor. Cure state cannot be determined from a single point measurement, but must be extracted from the change of ion viscosity and the shape of the curve over time. So software, which makes repetitive measurements, and stores and analyzes data, is crucial to the performance of the system.
Figure 4. Essential Elements of a dielectric cure monitoring system
209 Newbury Street, 3rd Floor
Boston, MA 02116
617-266-2837
email: info@lambient.com


Leave a Reply