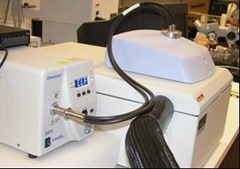
 In the previous post the UV DSC experimental set-up was described for several commercially available UV DSC systems. Image on the left courtesy of Perkin Elmer. The DSC cell design makes if very easy to irradiate a sample in a DSC pan and also determine the accurate baseline to enable quantitative measurements of the heat of reaction during UV curing. Let’s first discuss some experimental details to ensure that reliable and repeatable data is obtained. UV light sources give off heat during exposure, so the heating effects in the DSC need to be taken into consideration. Running two scans allows the baseline to be established and the second scan allows the heat of reaction to be measured.
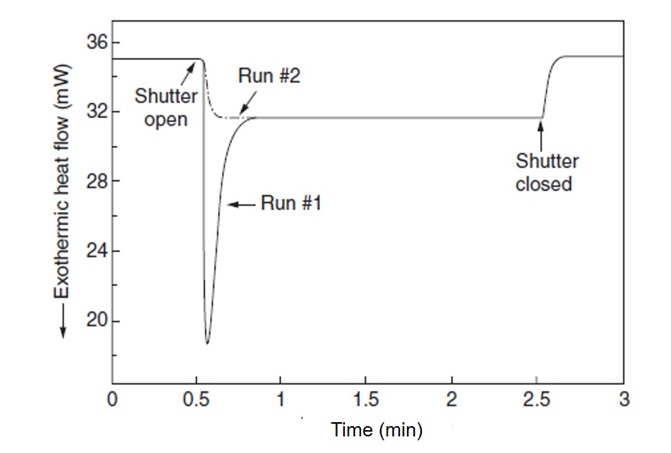
Figure 1. Heat Flow as a function of time for a UV curable resin irradiated for 2 minutes with 53 mW/cm2
In Figure 1, run #1 is the uncured sample. During a typical UV DSC run, the baseline is established prior to exposing the sample. In this case, the baseline was stabilized for 30 seconds and the UV lamp shutter was opened and the sample exposed for 2 minutes at 53 mW/cm2 (1). In run #1 there are two contributions to the heat flow; one from the heat of reaction due to the UV exposure and the second due to heating caused by the UV lamp. In Figure 1, there is a rapid increase in the heat flow when the shutter is opened followed by a sharp peak in the heat flow. The sharp peak is due to the photoinitiated polymerization and for this resin system the reaction is very fast. There is no heating ramp in this type of UV DSC run, the UV exposure is the only polymerization trigger. After 2 minutes, the shutter is closed and the baseline returns to the starting point. Run #2 is the sample sample but re-run immediately after the first run. The baseline is very repeatable and the heat of reaction can be measured by subtracting run #2 from run #1.
Many UV photoinitiators generate free radical during UV exposure. One drawback of the free radical systems is that oxygen quenches free radical and inhibits the reaction. To overcome this limitation, the DSC cell is purged with nitrogen to provide an inert atmosphere.
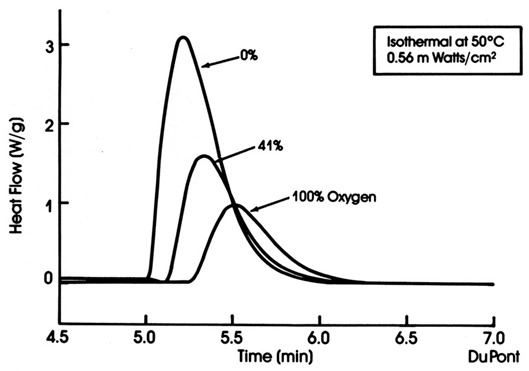
Figure 2. Heat flow as a function of time for various oxygen concentrations in the UV DSC cell
In Figure 2, three UV DSC curves are shown for three oxygen concentrations in the DSC cell: 0% oxygen, 41% oxygen and 100% oxygen (2). There is a dramatic reduction in the heat of reaction as the oxygen concentration increases demonstrating the free radical quenching. In the run in Figure 2, the baseline was established for 5 minutes before the shutter was opened and after the reaction was completed, the baseline returned to the original level.
As we have seen above, two key experimental aspects that must be carefully controlled are to purge the UV DSC cell with nitrogen and to carefully establish the baseline to allow quantitative measurements of the UV induced heat of reaction.
References:
1) Blair and Blyler (1985) in Fig. 2.78 in Thermal Analysis of Polymers, Menczel and Prime, Wiley, 2009.
2) Sauerbrunn et. al. Proceedings of the 16th North American Thermal Analysis Society (NATAS) 1987


Leave a Reply