UV DSC provides a convenient and accurate method to investigate UV curing of thermosets. With careful attention to experimental details (see previous post for more information), insights into the photoinitiated curing of thermosets can be obtained. This post provides some examples of how UV DSC can be used to characterize UV cured thermosets. In the first example the UV curing speed of two adhesives will be presented. In the second example, the heat of reaction and percent conversion are compared using UV DSC.
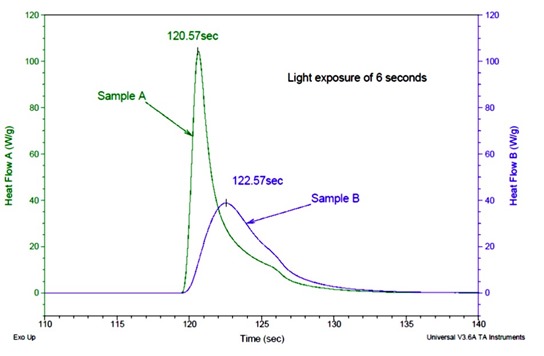
Figure 1. Heat flow as a function of time for two UV curable adhesive formulations (1)
In Figure 1, sample A is a fast UV curable adhesive and sample B is a general purpose UV curable adhesive. The DSC cell was maintained at room temperature during the UV exposure. The DSC run is started and the baseline is established prior to opening the shutter to the UV lamp. The samples were exposed to 25 mW/cm2 UV light for 6 seconds. Sample A has a much faster reaction rate (under the same UV exposure) as indicated by the rapid increase in the heat flow immediately after the UV exposure starts. Sample A reaches a peak maximum in 120.6 seconds while sample B takes 122.6 seconds to reach the heat flow maximum. One of the advantages of UV curing is the rapid reaction rates. Note in Figure 1 that for either sample, the UV photo reaction is completed in approximately 15 seconds (120 seconds to135 seconds). The practical implication is that UV curing can be a very rapid method to cure thin coatings very quickly in a manufacturing process.
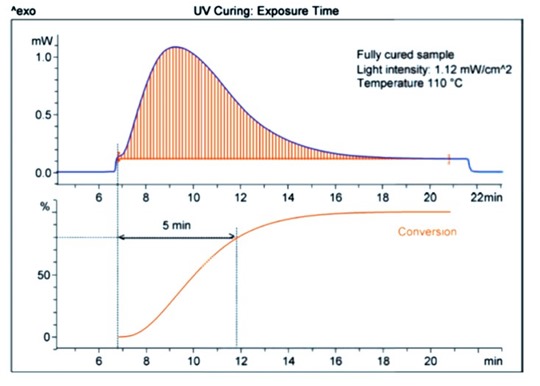
Figure 2. UV curing of a powder coating thermoset resin as a function of exposure time. (2)
In many industrial applications it is important to determine the fastest process time to achieve the desired properties (such as a UV curable powder coating) to minimize processing costs. In Figure 2, UV DSC was used to determine the optimum exposure time for a powder coating resin. In Figure 2, the top plot shows the heat flow as a function of time for an exposure of 1.12 mW/cm2 at a temperature of 110C. In this case, the UV curing reaction is fairly slow at this UV intensity. As is best practice, the baseline is established prior to UV exposure and the baseline returns to the original level after the UV lamp is turned off. The lower plot shows the percent conversion as a function of exposure time. Experiments on the coating determined that the minimum percent conversion to achieve the desired properties was 80%. From the lower graph, 5 minutes of UV exposure is the time required to achieve the desired 80% conversion.
Another variable in many UV curing reactions is the wavelength of the UV source. There are a wide variety of UV initiators and each has an optimum UV wavelength to maximize UV absorption.
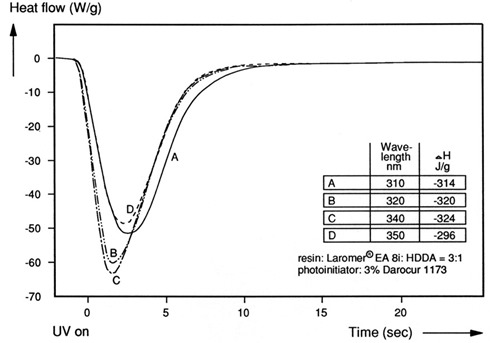
Figure 3. Heat flow as a function of UV exposure time at various UV wavelengths (3)
In Figure 3, the UV spectrum of the photoinitiator showed a maximum absorption at 320 nm. The UV DSC instrument was used to investigate the role of UV wavelength on the curing reactions. The table in Figure 3 shows the heat of reaction (delta H) as a function of exposure wavelength. A wavelength of 340 nm provides the optimum curing condition (largest heat of reaction). There is only a small difference in the heat of reaction between 320 to 340 nm, but the UV DSC method provides a sensitive experimental method for tuning the wavelength to get the optimum UV curing reaction.
References:
1) Louis Waguespack, Use of the Photcalorimeter Accessory (PCS) with Tzero DSC. www.tainstruments.com
2) DSC-Photcalorimetry System; Study of Photinitiated Reactions, Mettler Toledo www.mt.com
3) Kunze and Stapp (1988), RadAsia, Japan


Leave a Reply