Guest Post by Dr. R. Bruce Prime and Dr. John Avila
Like cooking, thermoset curing is a time-temperature process. Kinetics addresses relationships between time and temperature. For the next seven weeks we continue the series of 8 blogs on Thermoset Cure Kinetics posted in October, November and December 2014. The previous series covered the basic concepts of kinetics, including conversion or degree of cure, rate of conversion, rate constants, activation energy, and reaction orders. We discussed two common types of chemical reactions encountered in thermoset cure: nth order and autocatalytic. And we discussed time-temperature-superposition kinetics.
On the analytical side the utility of differential scanning calorimetry (DSC) was highlighted since it has the ability to measure both conversion and rate of conversion. Both isothermal and multiple heating rate kinetic measurements were discussed. We described the use of thermogravimetric analysis (TGA) to measure the progress of cure when the formation of a crosslink is accompanied by a discreet weight loss, for example in the cure of phenolic resins. The capability of dynamic mechanical analysis (DMA) was also described via the measurement of elastic modulus which is related to crosslink density or the measurement of the glass transition temperature (Tg) as a measure of conversion through the Tg-conversion relationship.
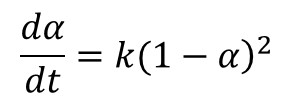
In Part 6 of this series A Practical Example of Cure Kinetics in Action we highlighted the case study of a fast-reacting polyurethane resin used in a pultrusion process. Multiple heating rate measurements yielded an estimate of the activation energy, which was then used in the construction of a master curve of conversion vs. time at a reference temperature. Polyurethanes typically follow 2nd order kinetics due to the reaction of a difunctional isocyanate with a trifunctional or higher-order alcohol, as embodied in Eq. 1.
(Equation 1)
Where α is conversion, t is time and k is the rate constant. Integration of Eq. 1 yields
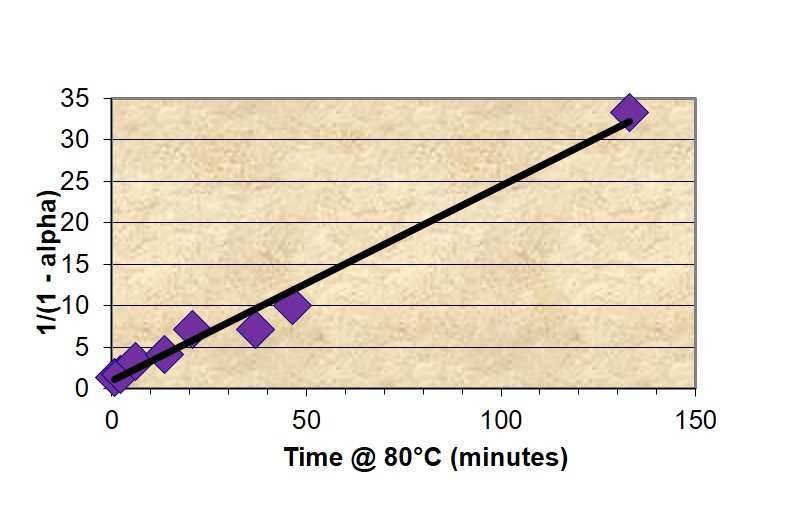
Thus for a reaction that follows 2nd order kinetics a plot of (1-α)-1 vs. time will be linear with an intercept of 1 and slope equal to k, as illustrated in Figure 1 for the fast-reacting polyurethane resin and confirming 2nd order cure kinetics. A kinetic equation was developed and conversion plotted along a typical pultrusion time-temperature profile.
Figure 1. Plot of conversion – time data from master curve according to 2nd order kinetics equation.
Some other thermosetting systems, most notably epoxies, follow autocatalytic kinetics. As illustrated in Scheme 1 (epoxy reacting with primary amine) and Scheme 2 (epoxy reacting with secondary amine) the reaction of a difunctional epoxy with a tetrafunctional amine results in a bond that adds to the size of the growing chain and eventually leads to crosslinking. But it also produces an alcohol that catalyzes further reaction of the epoxy with amine. The production of this internal catalyst is the basis for autocatalysis.
Scheme 1
Scheme 2
Equation 3 shows a common autocatalytic rate equation proposed by Sourour and Kamal (1) that is based on epoxy-amine chemistry (Horie et al. (2)). Where k1 is the catalyzed rate constant, attributed to added catalyst, impurities and/or fiber or particle surfaces that have a catalytic effect; k2 is the autocatalyzed rate constant, due to catalytic species produced by the reaction; and m and n are reaction orders. The chemistry for a stoichiometrically balanced reaction suggests that m = 1 and n = 2. For real systems with multiple components and possible imbalances in stoichiometry, values are often close but not identical to these. Since each epoxy-amine reaction produces one hydroxyl the alcohol concentration can be represented by the conversion a. Note that there are four unknowns k1, k2, m and n, necessitating nonlinear regression analysis to fit cure data to this equation.
In subsequent postings in this series we will add to our kinetics toolbox by developing mathematical approaches to kinetics and demonstrate their utility in two different ways. First we will explore the effects of added catalyst and stoichiometry on cure behavior, phenomena that could be of use to those designing or formulating thermosetting systems or to those just interested in the behavior of thermosets. We will also look at the fitting of epoxy-amine cure data to Eq. 3 by mathematically generating cure data with random noise to simulate actual experimental data. In this series we focus on isothermal cure and mathematically generated cure data and plan to examine the effects of temperature and the analysis of actual cure data at a later time.
References
- S. Sourour and M. R. Kamal, Thermochim. Acta 14, 41 (1976).
- K. Horie et al., J. Polym. Sci., Polym. Chem. Ed. 8, 1357 (1970).


Leave a Reply