Guest Post by Dr. R. Bruce Prime
 In Parts 1 – 5 of this series we have described basic kinetic principles, how to measure activation energy E, the role of isothermal DSC in kinetic analyses, and time-temperature superposition kinetics. Each of those may be viewed as a tool in our kinetics tool box. Here we describe how they were all used to solve an actual problem involving a fast-curing, two-part polyurethane system used in a pultrusion process that involved in-line mixing and rapid processing. The objective was to determine the kinetic equation and to use that equation to predict the evolution of cure during the production process. This study was presented at a national conference and published: Prime, Michalski and Neag,Thermochim. Acta, 429, 213 (2005).
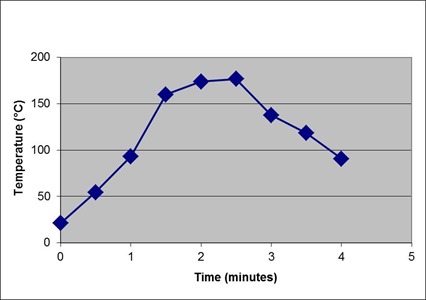
The polyurethane is mixed and cured in a pultrusion process that rapidly heats the parts to ~180°C in 2½ minutes before cooling to below 100°C, as shown in the temperature profile below. A high degree of cure needs to be achieved at the 2½ minute mark since the rate of cure will decrease rapidly as the temperature decreases. Tg¥ = 94°C was measured in this study, from which it is reasonable to assume from the profile that cure takes place under chemical control and that vitrification only occurs when the temperature drops below Tg¥ at the end of the process.
Typical time-temperature profile for pultrusion process.
Isothermal DSC would normally be the preferred approach to a complete kinetic analysis but presented challenges due to the highly reactive nature of this system. Above about 80°C, 100°C below the process temperature, isothermal DSC measurements cannot be made because significant reaction will occur before the isothermal temperature is reached. At lower temperatures only data prior to vitrification is usable since the reaction takes place under chemical control.
These challenges resulted in the following approach, where the objective was to quantify the parameters E, f(a) and A in Eq. 13, which results from combining Eqs. 1 and 2 in Part 1 of this series.
-
Assume cure can be described by a constant activation energy and measure E by the multiple heating rate method
-
Measure conversion after selected times at four temperatures between 30 and 80°C. Construct a conversion-time master curve using measured E.
-
Measure conversion vs. EIt after DSC cures at two t/T profiles that allow higher temperatures and give higher conversion levels. Add these results to the master curve.
-
Determine f(a) by fitting master cure curve to chemical equations for cure.
-
Determine A as the only remaining unknown in Eq. 13 above.
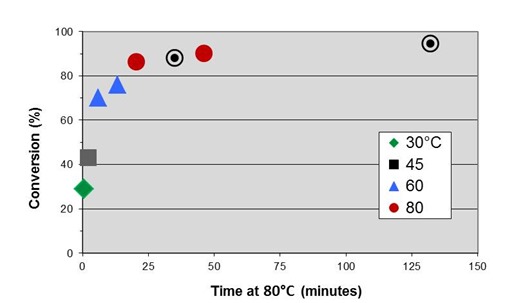
Reviewing from Part 5, an activation energy of 14.4 kcal/mole was measured by the multiple heating rate method, and an initial master curve of conversion vs. time at 80°C generated by shifting isothermal data to times at 80°C.
Initial master cure curve with additional target data points.
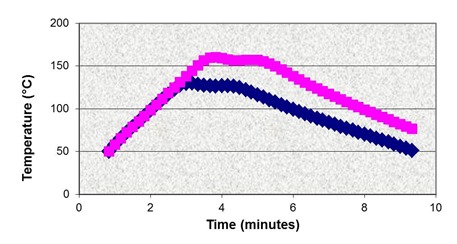
It was decided that a data point close to full cure was needed to match with the goal to achieve close to full cure in the process. In the figure above two target points are marked on the initial master curve, one to overlap with the isothermal data and one to provide a data point close to full cure but <100%. It was important that some small amount of cure could be measured so that the data point could be accurately placed on the master curve. The target data was obtained by curing in the DSC using the two profiles shown below, one with a maximum of 130°C and the other 160°C. Following cure the samples were rescanned to measure conversion and compute EIt values via Eq. 14.
130°C and 160°C profiles for samples cured in the DSC
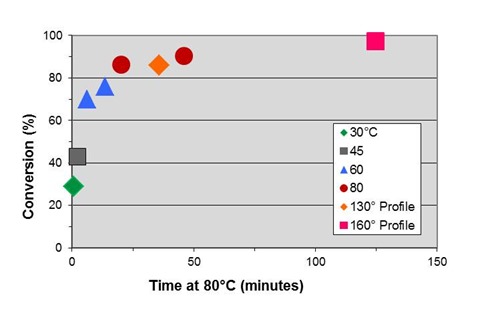
The results are shown in the table below and plotted in the figure below.
|
|
Calculated from Profile |
Measured |
|
130°C Profile |
EIt = 36 min at 80°C |
a = 86% |
|
160°C Profile |
EIt = 124 min at 80°C |
a = 97% |
Complete Master Curve for Polyurethane Cure
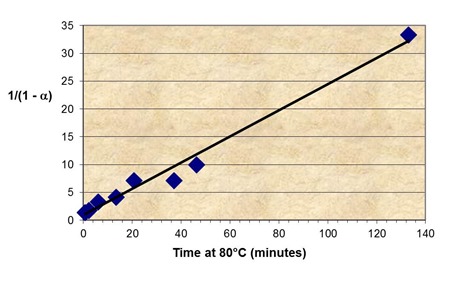
The slope of the master curve (da/dt), with the maximum rate at t = 0, indicates nth order kinetics. The first-order equation was shown to give a poor fit, whereas an excellent fit was found to the second-order equation, da/dt = k(1-a)2. The figure below shows a plot of 1/1-a vs. t, according to Eq. 15, the integrated form of this equation.
Not only does this confirm 2nd order kinetics, consistent with polyurethane cure, but also yields the rate constant from the slope, k80°C = 0.235 min-1.
Plot of conversion – time data from master curve according to 2nd order kinetics equation is shown below
The only remaining unknown in Eq. 13 is the pre-exponential factor A, which was calculated from the Arrhenius equation, Eq. 2, by substituting the measured values for k80°C and E
Wecan now completelydefine the rate equation for this polyurethane system.
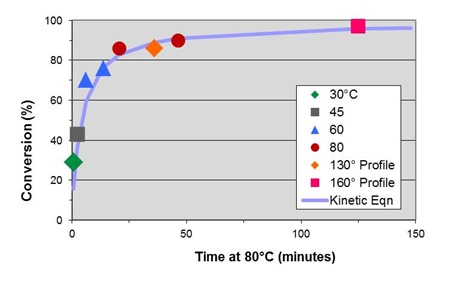
Master curve with conversion computed from Eq. 18 (solid line) is shown in the following figure:
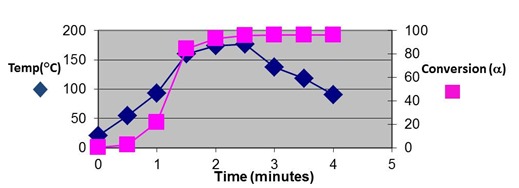
Themaster curve above contains a plot conversion vs. time calculated from Eq. 18, obtained by rearranging Eq. 15. As can be seen the kinetic equation gives a good representation of the data over the entire range of the cure process. Finally, in the figure below the complete kinetic equation allows us to project the progress of cure in the pultrusion process.
Conversion from kinetic equation showing evolution of cure along pultrusion profile

![clip_image002[8] clip_image002[8]](https://polymerinnovationblog.com/wp-content/uploads/2014/12/clip_image0028_thumb.png)
![clip_image002[10] clip_image002[10]](https://polymerinnovationblog.com/wp-content/uploads/2014/12/clip_image00210_thumb.png)
![clip_image002[14] clip_image002[14]](https://polymerinnovationblog.com/wp-content/uploads/2014/12/clip_image00214_thumb.png)
![clip_image002[18] clip_image002[18]](https://polymerinnovationblog.com/wp-content/uploads/2014/12/clip_image00218_thumb.png)
Leave a Reply