Guest Post by Dr. R. Bruce Prime
 In previous posts in this series we have described basic kinetic principles, how to measure activation energy E and its constancy or variation with conversion, and the role of isothermal DSC in kinetic analyses. Here we add yet another tool: time-temperature superposition or TTS kinetics. TTS kinetics was introduced in the June 2, 2014 post. Here we review salient attributes and expand on its applications to thermoset cure kinetics. As we will see one of the two main features is its ability to summarize a vast amount of data into a master curve of conversion or Tg vs. time at a reference temperature Tref. By varying Tref it is possible to predict the course of cure at any temperature. Its other attribute is to characterize the cure of actual processes that follow a non-linear time-temperature profile, be it parts placed in a hot oven that slowly ramp up to the oven temperature or a composite cure process with multiple time-temperature segments.
First, TTS kinetics applies only when the process can be described by a single or overall activation energy, i.e. there is no change in reaction mechanism and the only effect of temperature is to increase or decrease the reaction rate .
To illustrate, in the schematic figure below one observes conversion vs. ln (time), or Tg vs. ln (time), at two isothermal temperatures, T1 and T2, where T1 is higher than T2. Note that these curves are parallel and separated by a shift factor aT. The fact that these cures are parallel means that aT is constant and the curves can be superimposed, e.g. by shifting the T1 data to the right by the amount aT to create a master curve of conversion or Tg vs. ln(time) at Tref = T2. In an actual cure study data is collected at several temperatures and the choice of reference temperature is arbitrary, but typically chosen in the mid-range of the cure temperatures.
The shift factor aT is based on the Arrhenius Eq. 2 and given by:
where aT is the ratio of the times to reach the same conversion or Tg at the two temperatures. Since aT is constant it follows that E is constant and may be calculated from Eq. 10 when aT is known.
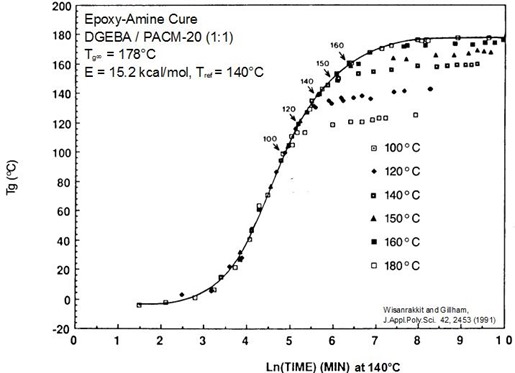
The figure below is a master curve of close to 100, Tg – conversion data points at six temperatures. The solid line shows the reaction under chemical control. The onset of vitrification and subsequent slowing of the reaction can also be observed.
Master cure curve for epoxy-amine system. Arrows mark vitrification at Tg = Tcure.
From Wisanrakkit and Gillham, J. Appl. Poly. Sci 42, 2453 (1991).
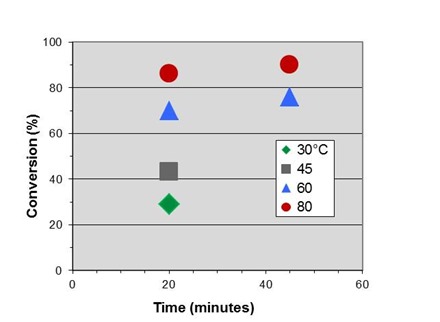
The figure below shows conversion vs. time data at four temperatures for the fast-reacting polyurethane, discussed in previous posts and the subject of the case study to be presented in Part 6 of this series.
In Part 2 we measured an activation energy for cure of 14.4 kcal/mole. By rearranging Eq. 10 for this application we obtain:
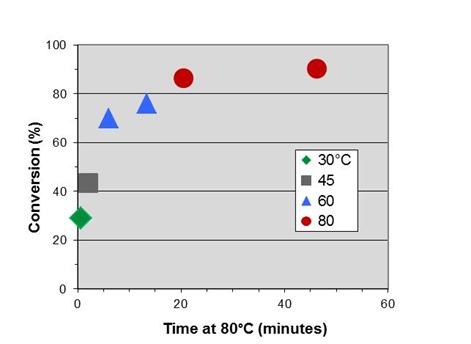
where T is in degrees Celcius. Letting T2 = 80°C = 353K we can shift the data to generate an initial master curve below, which we will expand on in the next post.
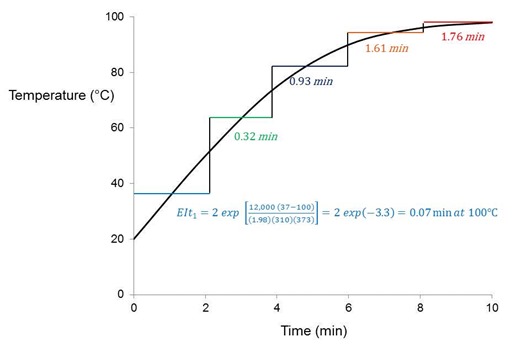
We wrap up this post by introducing the equivalent isothermal time or EIt, a means to characterize the cure of real processes that do not follow a linear time-temperature (t/T) profile. Utilizing Eq. 10, and as illustrated in the figure below, this methodology “integrates” the t/T profile, breaking it into sections of equal time ti at average temperature Ti that are converted to an equivalent time t2 at a reference temperature T2.
Consider a part at room temperature put into an oven at 100°C for a total of 10 minutes. A thermocouple attached to the part records the t/T profile shown. The activation energy for cure is 12 kcal/mole. The question we wish to answer is: What is the equivalent amount of cure time at 100°C, which must be less than the 10 minute process time? From Eq. 12 we accomplish this by breaking the profile into five 2 minute sections, converting each section to an equivalent time at 100°C, and summing those times to get the process EIt = 0.07 + 0.32 + 0.93 + 1.61 + 1.76 = 4.7 minutes at 100°C. This part would have a cure that is equivalent to being held isothermally for 4.7 minutes at 100°C. When applied to a real process the time increments would be much smaller.
Illustration of profile EIt calculation where part at room temperature is placed in oven at 100°C. Profile EIt = å EIti.
In the next post we present a case study where all of the tools we have discussed so far were used to develop the entire kinetic equation for cure of the fast-reacting polyurethane.


![clip_image002[6] clip_image002[6]](https://polymerinnovationblog.com/wp-content/uploads/2014/11/clip_image0026_thumb2.png)
![clip_image002[8] clip_image002[8]](https://polymerinnovationblog.com/wp-content/uploads/2014/11/clip_image0028_thumb.png)
Leave a Reply