Post by Dr. R. Bruce Prime
In the previous post we gave an introduction to cure kinetics. Here we show how to begin a kinetic study. Whether it is getting a quick feel for how much time to allow for an adhesive to cure at a given temperature or delineating the complete kinetic equation, a survey DSC, e.g. at 10°C/min, is always the recommended first step. A heat-cool-heat run is even better since it will also give Tg¥, and if started at a low enough temperature, Tg0. Hopefully this will show a simple symmetric curve that will portend a straightforward kinetic analysis. But if there is a shoulder or even an additional peak, indicating a complex cure reaction, it is best to know this at the outset. Following the survey run a plan can be constructed to achieve the objectives.
From Prime, et al., Thermochim Acta 429, 213 (2005).
The figure above is such a survey run on a two-part fast-reacting polyurethane resin used in a pultrusion process. It is the subject of a case study, to be presented in a future post in this series, where DSC was used to develop the complete kinetic equation. Because it is highly reactive it was mixed, placed in a sample pan, weighed and the run started in <2 minutes from being mixed. The amount of reaction prior to starting the DSC run was determined to be <1%.
What can we say about this DSC trace?
-
Because the reaction is so fast the DSC cell was chilled to ~5°C to slow the reaction prior to the run. Even so it was just possible to establish a pre-reaction baseline before the onset of the cure exotherm, further emphasizing the speed of the reaction.
-
There is one major exotherm with a peak temperature of 88.7°C plus a tiny second exotherm (<1% of the main exotherm) with a maximum near 200°C. It was judged that this second exotherm could be due to variability in mixing the small amounts of the two reactants and was so small that it could be ignored. This turned out to be justified by the outcome described in the case study.
- A detailed kinetic study requires conversion-time data from isothermal DSC measurements, which are challenging for this system. Low temperature experiments, e.g. near room temperature, would be limited by vitrification. Note that the goal was to describe the reaction under chemical control. Higher temperature experiments would be limited by unrecorded pre-reaction prior to reaching the cure temperature. The decision was made to collect as much isothermal data as possible at four temperatures and use time-temperature superposition to construct a master cure curve. To do this requires the activation energy for cure which was measured by the multiple heating rate technique illustrated below.
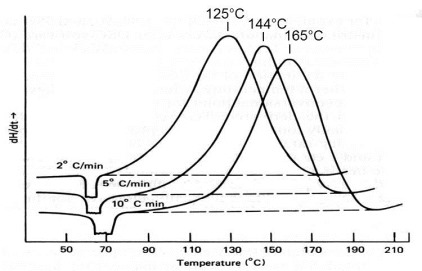
DSC of an epoxy at three heating rates. From Swarin and Wims, Anal. Calorim. 4, 155 (1976).
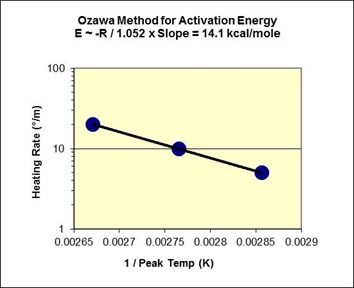
Following the survey run at 10°C/min additional DSC runs on the polyurethane system were made at 5 and 20°C/min and the peak exotherm temperatures recorded, as illustrated in the figure above. 1/Tp (in degrees Kelvin) was plotted against the ln(heating rate) q in the figure below according to the Ozawa equation [Ozawa, Bull. Chem. Soc. Jpn 38, 1881 (1965) and J. Therm. Anal. 2, 301 (1970)]
where R is the gas constant (1.987 cal K-1 mol-1 or 8.314 J K-1 mol-1).
Plot of ln (Heating Rate) vs. 1/Tp according to Eq. 5 for Fast-reacting Polyurethane
The slope is linear and has a value of -7477, which yields
E ~ (-R x Slope)/1.052 = (-1.98 x -7477)/1.052 = 14.1 kcal/mole
When the Doyle correction was applied [Doyle, Anal. Chem. 33, 77 (1961)], a final value of E = 14.4 kcal/mole (60.2 kJ/mol) was obtained.
In the next post we examine the multiple heating rate method in more detail and show how to get a measure of the complexity of the cure reaction from E = f(conversion).


Leave a Reply