Guest Post by Dr. R. Bruce Prime and Dr. John Avila
In this post we explore how adding an external catalyst or accelerator to increase the reaction rate can affect the cure path of autocatalytic cure reactions, providing additional insight into the behavior of epoxy-amine thermosets as well as commenting on some of the pros and cons of doing so. We show how added catalyst can explain the difference between a 60-minute epoxy and a 5-minute epoxy and illustrate how adding catalyst differs from increasing temperature to accelerate the cure process. A good reference on this topic is Acceleration of Amine-Cured Epoxy Resins by B. L. Burton, Huntsman Corp.
We start with the chemically based Eq. 2 from the previous post where the stoichiometry is balanced, ie B = 1
dα/dt = (k1 + k2 α)(1-α)2 (1)
Recall again that the term (1-α) represents the concentration of reactants, eg the epoxide and the amine in an epoxy-amine system and that a represents the concentration of catalyst generated in the reaction, eg hydroxyl functionality in the case of epoxide reacting with amine. k2 is the rate constant for the autocatalytic reaction and k1 the rate constant for the externally catalyzed reaction, which can be accomplished by impurities in the reactants, by the surfaces of fillers or by added catalyst.
In this exercise we keep k2 constant at a value of 0.01 sec-1 and incrementally increasing the value of k1 to simulate the effect of adding catalyst. We chose the four values shown in the table below and generated α and dα/dt vs. time data utilizing the methodologies described in the previous post. Note that a very small value of 0.00001 sec-1 was assigned to k1 for the No added catalyst case to simulate the unavoidable presence of impurities in the reactants including absorbed moisture.
The table below summarizes the cases evaluated while Fig. 1 shows projected results for the Small catalyst level case. Note that, as predicted by Eq. 1, dα/dt = k1 at t = 0. This is demonstrated more clearly in Fig. 3 and suggests the ability of conversion rate measured by isothermal DSC to estimate k1 and shed light on the catalyst level. We say estimate, because the conversion rate at t = 0 is obtained by extrapolation and, as shown in the next post, the full relationship is dα/dt = Bk1 at t = 0 which only equals k1 when B = 1. Also note that k1 encompasses an underlying rate constant, the concentration of external or added catalyst, and the strengths of the catalysts.
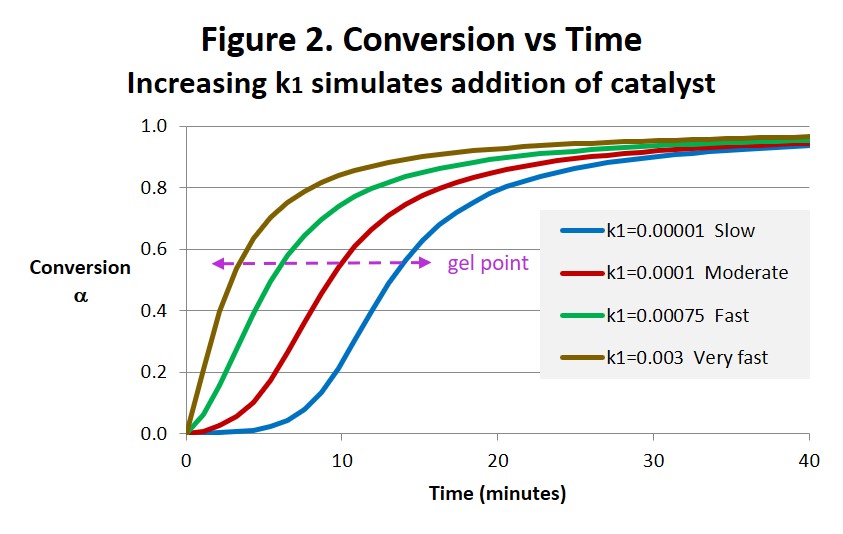
Several effects can be noted in the conversion-time curves in Fig. 2 below, both in the speed of the reaction and in the shape of the curves. As expected the addition of catalyst accelerates the reaction. But also notice how the shapes of the curves change from typical autocatalytic behavior with obvious inflection for the No added catalyst case to progressively less autocatalytic with increasing k1 and eventually to a curve that more closely resembles nth order characteristics with no observable inflection. With a typical autocatalytic epoxy the early reaction is slow due to lack of catalyst and only picks up after sufficient catalyst is generated, having the effect of extending the work life. Adding catalyst not only accelerates the overall reaction but diminishes and eventually eliminates this extension of the work life. This amplifies the effect on gelation resulting in a dramatic shortening of the work life vis-à-vis a smaller effect on the overall cure (eg time to 95% conversion). As shown in Thermoset Characterization Part 5: Calculation of Gel Point (posted May 12, 2014) the conversion at the gel point αgel = 0.58 when B = 1 which is indicated in Figure 2.
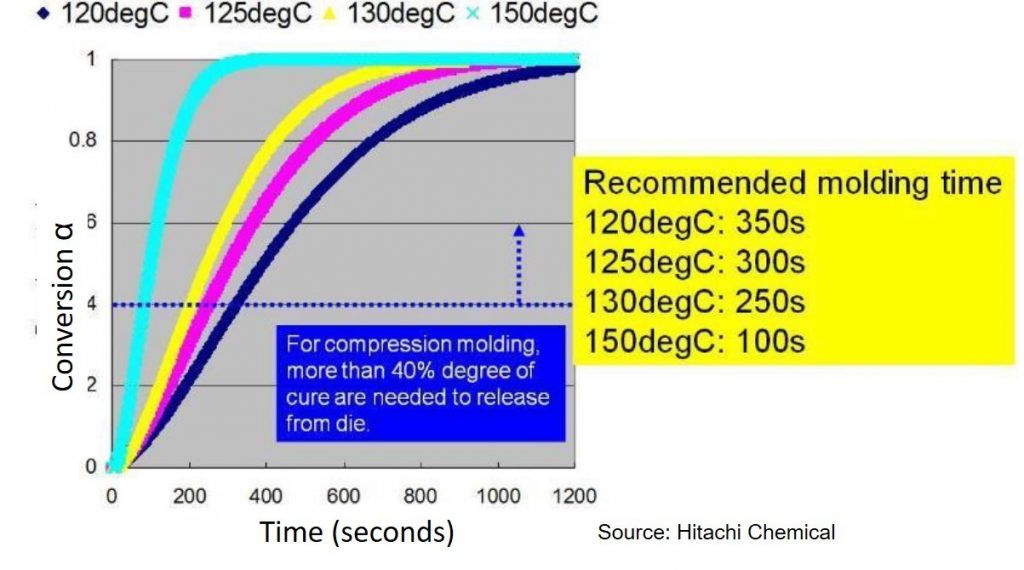
Figure 2 should be compared and contrasted with Fig. 1 in the previous post and reproduced as Fig. 3 here. The material and process descriptions of this epoxy mold compound (EMC) were described in the previous post. Like the addition of catalyst, increasing the temperature clearly accelerates the reaction speed. But unlike the addition of catalyst the shapes of the curves, all close to the Intermediate catalyst level curve in Fig.2 (k1 = 0.00075 sec-1), remain the same indicating that increasing temperature only speeds up the reaction but in general doesn’t change it. As a consequence these curves could be superimposed to form a master cure curve (see Thermoset Cure Kinetics Part 5: Time-Temperature Superposition Kinetics (posted November 24, 2014).
Figure 3. Degree of cure (conversion) as a function of time for various mold temperatures for an epoxy mold compound (source: Hitachi Chemical).
The rate of conversion-time curves in Fig. 4 also show the reaction shifting to shorter times as the reaction accelerates with added catalyst and losing its autocatalytic character. In the Very fast reaction there is just a hint of the characteristic autocatalytic peak in the curve. Additional catalyst will result in the maximum rate occurring at t = 0, which is characteristic of entirely nth order reactions.
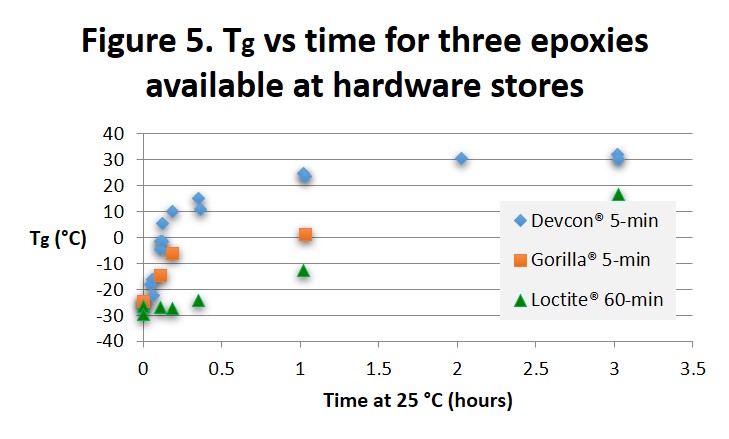
It is interesting to compare the conversion-time curves in Fig. 2 with the Tg-time curves from MTDSC of Thermosets Part 5: Five-Minute Epoxy, Continued (posted August 10, 2015) and reproduced in Fig. 5 below. The 60-minute epoxy exhibits some autocatalytic behavior similar to the Moderate curve in Fig. 2 while the two five-minute epoxies show nth order behavior similar to the Very Fast curve.
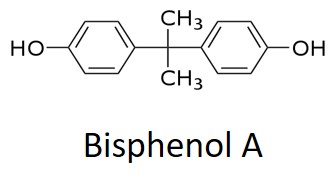
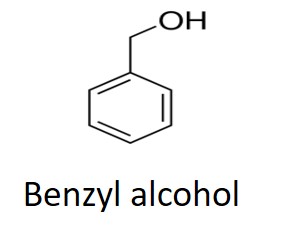
Tg begins to increase almost immediately for the two 5-minute epoxies which then separate as the faster Devcon® epoxy approaches its full cure Tg of 35 to 40°C and the Gorilla® epoxy lags slightly behind. Recall that the 5 and 60 minute labels refer to the work life and approximate gel times. Notice that the Tg achieved in 60 minutes at 25°C for the Loctite epoxy is about the same as the Tgs achieved for the Devcon and Gorilla epoxies after 5 minutes. The Loctite® 60-minute epoxy undergoes a much slower increase in Tg and shows characteristics of autocatalytic cure where the rate of increase in Tg accelerates with time in the early part of cure. From the Material Safety Data Sheets (MSDS) all three adhesives contain a bisphenol A epoxy resin and a hardener. Devcon lists the hardener as Trade Secret, Gorilla lists three amines plus 0.1-1.0% bisphenol A which, with the two hydroxyl groups as shown below, will catalyze the epoxy-amine reaction, and Loctite lists several amines and 1-5% benzyl alcohol with a single hydroxyl as shown below. We speculate that the difference in the level and catalytic strength of these two alcohols accounts for the different reaction speeds.
To summarize, the addition of catalyst will accelerate the epoxy-amine reaction and at the same time alter its character from autocatalytic toward nth order with a marked reduction in the work life and time to gel. Increasing temperature will also accelerate the reaction but without altering its autocatalytic nature. We should remind readers that DSC has the unique ability to measure both conversion and rate of conversion vs. time, accounting for it being a preferred method to characterize the cure process. In the next post we explore the effect of stoichiometry on cure.



Leave a Reply