 In our last post we described the technique called time-Temperature superposition. Using t-T superposition, a “master curve” can be constructed that is useful in analyzing the curing of thermosets. The requirement is to have either conversion or glass transition temperature (Tg) data as a function of time for several isothermal cure temperatures. (Image on left courtesy of Hexcel, PHexPly Prepreg Technology Guide)
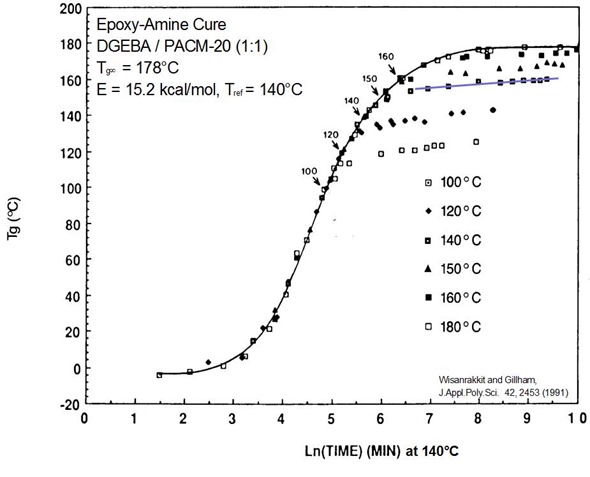
Using time-Temperature superposition, the following master curve was constructed for a typical epoxy cure.
The point where Tg=Tcure is noted on the master curve (100, 120, 140, 150, and 160). The master curve makes it easy to identify some key features of thermoset curing. First, all of the data nicely superpose onto the reference curve denoted by the black line. It is interesting to note at below Tg=Tcure, all of the curves line up on the master curve. Examining the data for each case of where Tg is greater than Tcure, the curves systematically “peel off” or deviate from the reference curve. The physical reason for the deviation is vitrification. As the crosslinking reaction causes the Tg to increase and eventually pass the cure temperature ultimately causes the material to change from a crosslinked gel to a gelled glass (i.e. vitrify). With this phase change into the glassy regime, the chain segmental mobility dramatically decreases and the result is a significant slowing of the cure rate. Notice that the cure rate does not to go zero.
In the figure above, the 140C data above Tg=Tcure is highlighted by the blue line. Notice several important details.
- Above Tg=Tcure, the slope of the line is small but not zero indicating continued crosslinking under diffusion control
- The same phenomenon occurs for each curve above the Tg=Tcure point
- Arrows show reaction kinetics are fast up until about Tg=Tvit + 20C
- The solid line indicates reaction under chemical control.
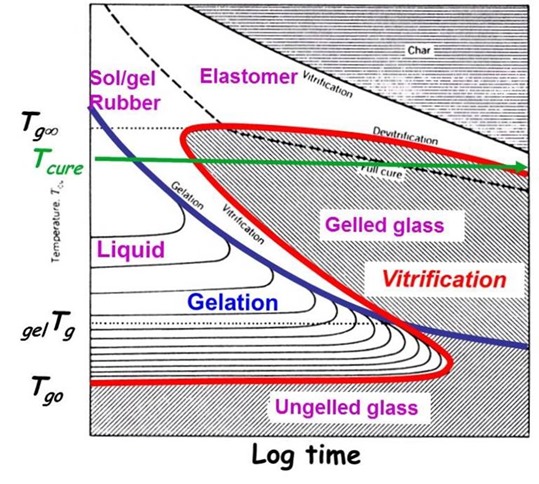
With this understanding, let’s take another look at the TTT diagram and see how this all fits together:
Looking at the green curve on the TTT diagram demonstrates the phase changes that occur at the curing temperature, Tcure. In the case of the green curve, the cure temperature is below the fully cured Tg, denoted Tg¥. Following along the green curve as a function of time, the curing reaction starts first with chain extension due to the hardener nucleophilic addition to the epoxy groups.
As the cure proceeds, the extended chains begin to form crosslinks and the conversion reaches the gel point (denoted by the blue gelation curve in the TTT diagram). Remember, the cure rate does not change at the gel point. With further curing, the network builds to the point where Tg=Tcure and vitrification occurs (the green line intersects the red vitrification curve). As we observed in the Tg-time master curve above, the reaction rate dramatically slows as the reaction transitions to diffusion control in the glassy state. The cure may continue in the glassy state at a very slow rate (this is why prepregs are stored in a freezer).
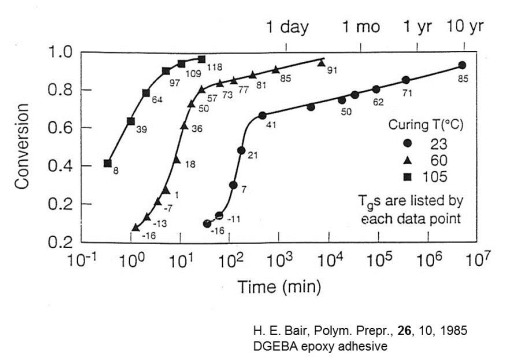
To reinforce this point, remember our tenacious scientist, Harvey Bair at Bell Labs. He cured a DGEBA epoxy adhesive and left it on his desk for up to 10 years and periodically measured the conversion using DSC. In the following figure one can observe that at 23C, the reaction rate is very slow, but the thermoset continues to cure even over a decade in the glassy state!
From the TTT diagram, the practical implications of gelation and vitrification can be summarized:
- Store catalyzed, unreacted thermosets below Tg0 (in the ungelled glassy region)
- B-stage thermosets between Tg0 and gelTg (liquid region prior to the gel point)
- For fasted time to full cure, use Tcure > Tg¥ (in the gelled rubber region to avoid vitrification)


Leave a Reply