 In our last post we discussed the concept of vitrification and the impact on the cure kinetics (dramatic slowing of the reaction rate in the glassy state). When examining curing data such as the Tg versus cure time plots from the last post, it is often helpful to create a “master curve.” Remember the Tg-time relationships had the same shape but appeared to be shifted along the time axis.
Let’s explore the concept of time-temperature superposition as means to more instructively evaluate thermoset curing.
- Is a means to create a “master curve” to get a feel for the big picture, predict behavior
- Applies only when the effect of temperature is to increase or decrease the reaction rate
- Assumes a single or overall activation energy
- Yields insights into the process kinetics
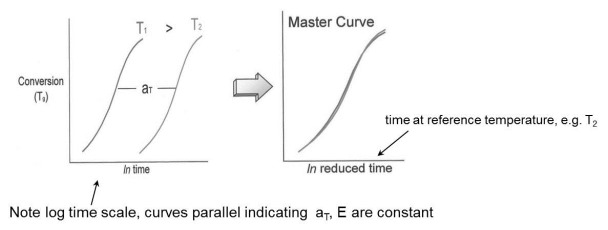
In the figure below, one observes two cure curves (conversion vs. time or Tg vs. time) at two isothermal temperatures, T1 and T2. Since the activation energy is constant, we can shift the curves along the time axis by the amount of the shift factor, aT . The result is a master curve where all the data are shifted to the reference temperature. The choice of reference temperature is arbitrary, but one typically chooses the reference temperature in the mid-range of the cure temperatures.
The shift factor aT is given by:
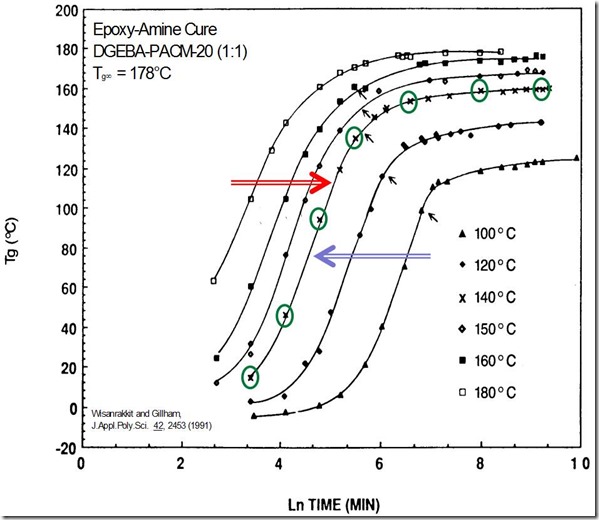
To construct the master curve, the reference temperature is selected and the experimental data is shifted towards the reference temperature. In the figure below, the reference temperature was chosen to be 140C and we see the higher temperature cure curves are shifted to the right and the lower temperature curves are shifted to the left. The green circles highlight the chosen reference temperature curve.
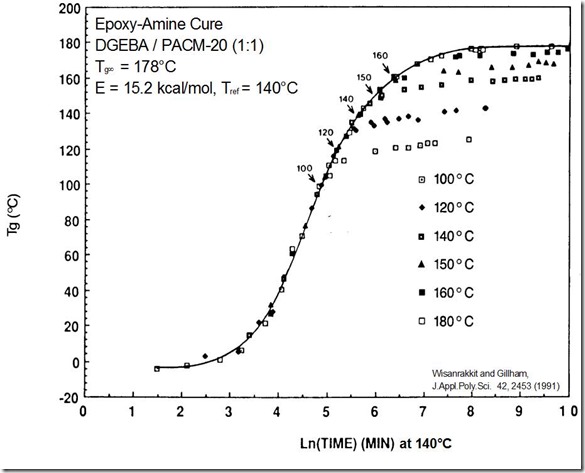
Once all of the curves have been shifted then the master curve is obtained as shown in the next figure:
In the next post we will discuss the above master curve in more detail.


I like to have un program of concept of time–temperature superposition (tts) principle and master curve formation, each color represents data in different temperature.