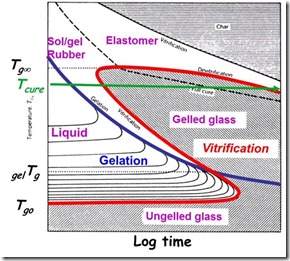
 Vitrification, now that’s an interesting word to use in a thermoset polymer discussion. The Merriam-Webster online dictionary defines vitrify as “to convert into glass or a glassy substance by heat and fusion.”
In the case of thermosets, the definition is pretty close, since the glassy state can be obtained during cooling from the rubbery state and as we will see in this post, vitrification can occur under the right conditions during curing. In thermoset curing, vitrifcation is the development of the glassy state as the curing reaction increases the Tg to the cure temperature. Vitrification occurs when temperature Tg = Tcure.
First, let’s provide some definitions of vitrification in the context of thermosetting polymers:
- Glass formation due to Tg increasing from below Tcure to above Tcure as a result of reaction
- Definition of vitrification: Tg = Tcure
- Only occurs when Tcure < Tg¥
- Reversible by heating: liquid or gel back to glass
- Dramatic slowing of rate of cure and the reaction becomes diffusion controlled
- Observable by DMA or dynamic rheology as frequency-dependent loss peaks with large increase in modulus
- Observable by Modulated Temperature Differential Scanning Calorimetry (MTDSC) as step increase in heat capacity
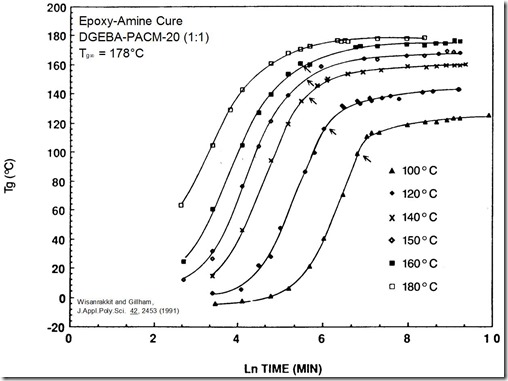
In the section on DSC, Dr. Prime discussed how to measure the cure profiles for thermoset curing. In the following figure, the glass transition temperature (Tg) is plotted as a function of time for various isothermal cure temperatures.
In the above figure, small arrows show were Tg = Tcure. A few characteristic features are clearly visible. The slopes of the Tg – Time curves are parallel in the early stages of curing. The overall shapes of the curves are also very similar. The key feature to note is that the rate of increase in the Tg slows dramatically after Tg = Tcure. The cure rate slowing is very obvious in the 100 and 120oC curves. As discussed in the gelation post, the cure rate does not change as the chemical reaction passes through the gel point. This is not the case however with vitrification. As the Tg increases due to the chemical crosslinking, when the Tg exceeds the Tcure, the thermoset begins to transition into the glassy phase. Think of this as a glass transition temperature in reverse, driven by chemistry/crosslinking, not by a temperature change as observed in a typical Tg heating curve by DSC or DMA.
Another key feature is that vitrification is reversible. In the case of gelation, the gel point is defined by the chemistry and once the thermoset is gelled, it cannot “ungel.” One readily observes that the glass transition in all polymers is reversible in that heating to above the Tg results in a liquid or rubbery phase and subsequent cooling through the glass transition temperature results in a glassy phase. During thermoset curing, if the cure temperature is increased, the network may again transition through Tg and back into the rubbery phase (since it will typically be past the gel point). Once in the rubbery phase, the reaction kinetics will increase.
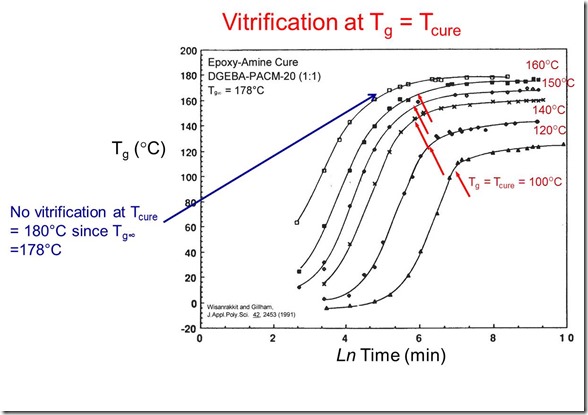
In the following figure, the key attributes of the particular curing system are noted:
In the above figure, the fully cured Tg was 178oC. Note that no vitrification occurred during curing at 180oC since the cure temperature was above the final Tg. Also note at all cure temperatures below 178oC, there is some slowing of the reaction rate.
This has very important practical implications. When curing a thermoset, it is critical to know the ultimate fully cured Tg. To insure full cure during processing, then the cure temperature must be greater than the fully cured Tg (Tg¥ ). If the cure temperature is lower than Tg¥, then several unwanted conditions can occur:
-
The cure rate slows after Tg = Tcure requiring a longer cure time (more expensive) to achieve a high degree of conversion
-
The final Tg might not reach the fully cured Tg. Depending on the application, under-cured thermosets have a large decrease in Tg and physical properties.
-
In subsequent thermal processes where the temperature exceeds the partially cured Tg, the Tg would increase resulting in variation in the physical properties.
In our next post, we will discuss the concept of Time-Temperature Superposition as a way to compare thermoset cure profiles using a master curve.


Leave a Reply