Guest Post by Dr. R. Bruce Prime
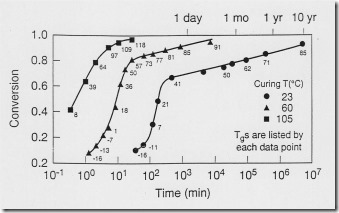
 A thermoset cures due to the chemical reactions discussed in earlier posts. The figure on the left shows how the chemical reaction (conversion of reactive groups) can be monitored over time. Note the time scale on the plot! A very patient scientist named Harvey Bair at Bell Labs made samples for a cure study and then left them on his desk and measured the curing over a 10 year span (H. Bair, unpublished data). Note that even at room temperature, the curing reaction proceeds, albeit very slowly at room temperature. So let’s take a closer look at how one would conduct such an interesting curing study.
As described previously DSC can measure conversion (aka degree of cure) and Tg. Here we demonstrate how cure may be tracked by both conversion and Tg and establish the important Tg – conversion relationship.
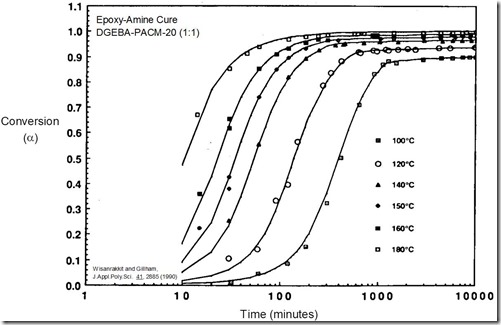
Figure 1. Conversion vs. ln(time) curves for an epoxy-amine system. From Wisanrakkit and Gillham, J. Appl. Poly. Sci. 42, 2453 (1991).
Figure 1 from the previous post contained DSC scans of an epoxy-amine cured at 160°C for various times between zero and 16 hours. Each scan showed Tg and the residual cure exotherm DHres. For the time zero curve the exotherm is the total heat of reaction DHrxn. Also shown was the calculation of the conversion a from DHres and DHrxn. The plot above shows the conversion – ln(time) data at 160°C for the same epoxy-amine plus five additional cure temperatures. You should notice:
- a series of curves that are parallel for the first 80+% of cure
- the highest temperature curves are at the shortest times
- at the lower cure temperatures the reaction appears to stop before the reaction is complete.
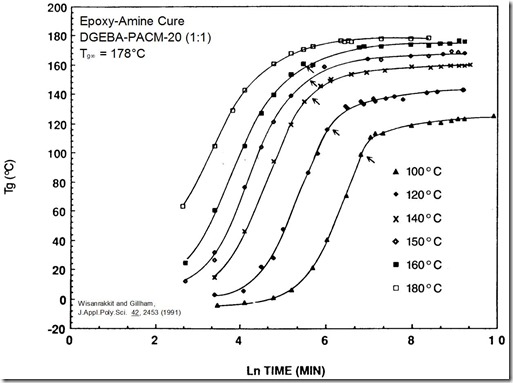
Figure 2. Tg – ln(time) curves for the same epoxy-amine.
Figure 2 shows that Tg – time curves are very similar to conversion – time curves. Here we introduce vitrification, glass formation due to reaction and defined as the point at which Tg = Tcure, which is easily identified in Fig. 2 and marked by the arrows. Vitrification will be the subject of a future post. You should notice
- vitrification occurs while the reaction is still fast
- following vitrification Tg increases ~20°C before the reaction slows significantly
- reaction in the glassy state (23°C) is slow but it still continues, as Harvey’s plot at the top of this post shows
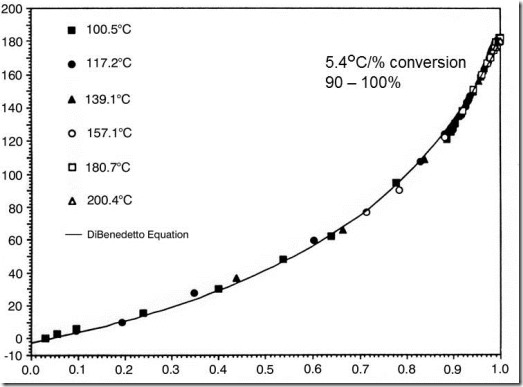
Figure 3. Relationship for Tg and conversion for the same amine-epoxy system.
Figures 1 and 2 show that cure can be tracked by Tg as well as conversion, and suggest there may be a relationship between these two parameters. Several workers have shown that for most thermoset systems there is indeed a unique relationship between the chemical conversion of a thermoset and its glass transition temperature, independent of the cure temperature and thermal history (see, for example, Refs. 1–3). As can be seen from the increasing curvature of the data in Figure 3, Tg is a more sensitive measure of cure than is conversion in the latter stages of cure, which are often the most critical. For thermosetting systems in which weight loss is associated with cure (think phenolics) or for which there is no simple exotherm, Tg is often the only practical means to monitor extent of cure. To summarize
- Tg is equivalent to conversion as a measure of degree of cure
- Tg is more sensitive in the latter stages of cure
- For some thermosets Tg is the only practical means to measure cure
References
- J. P. Pascault and R. J. J. Williams, J. Polym. Sci., Part B: Polym. Phys. 28, 85 (1990).
- A. Hale, C. Macosko and H. E. Bair, Macromolecules 24, 2610 (1991).
- R. A. Venditti and J. K. Gillham, J. Appl. Polym. Sci. 64, 3 (1997).


Is there a way to plot the set of curves TG vs time by optimizing the number of measurements to a minimum?
I would liked to predict a glass transition temperature with a minimum of measurements like:
– the maximum glass transition temperature
– one or two cure isotherm curve of conversion rate vs time
Is this possible ?
The easiest way to determine the final Tg is to run two scans in the DSC if the material is in liquid (or uncured) form. The first scan will give you delta H (and a Tg if there is one). Make sure to run the temperature in the DSC above the estimated final Tg value, but be careful not to degrade the sample. Then cool and run a second scan and this should be very close to the fully cured Tg. Another way would be to make a DMA bar and do a high temperature cure (potentially based on the DSC experiment described before). The DMA run will give you the dynamic moduli and the Tg range.