 In the last post an introduction to DMA was presented to set the stage for the next two posts. In this post I will discuss the various types of geometries that can be used in DMA experiments as well as some guidelines for instrument parameters. First let’s discuss sample geometries.
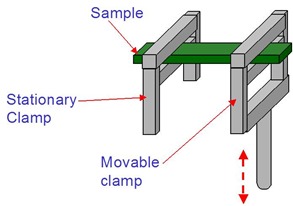
Single Cantilever Beam
- Unsupported samples can be made in Teflon or silicone rubber molds, generally 0.5 to 2.5 mm thick
- Can be quantitative if dimensions precise, requires length correction for clamps
- Good for solid samples, e.g. beyond the gel point
Three Point Bend
- Good for medium to high modulus materials
- Requires restoring force; typically used on highly cured thermosets
- Clamping effects eliminated, purest deformation mode
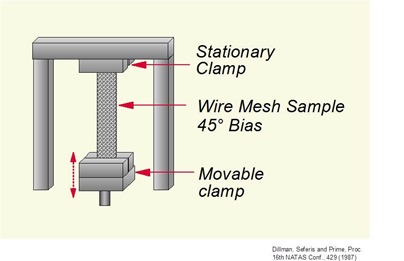
Wire Mesh Geometry
- Support for liquid or paste materials
- Note the wire mesh is used on a 45o bias, otherwise the experiment would be dominated by the high stiffness wire. When used in the 45o bias, the properties of the resin will dominate the response
- Controlled thickness, sensitive measure of Tg
- Can extract thermoset G’, G” via composite analysis
Experimental Considerations
- Thermal scan at a single or multiple frequencies is the most common method for thermosets (obtain modulus and Tg)
- Fixed frequency scans done at 1 Hz (ASTM E1640-07 specifies the use of 1 Hz for determining Tg)
- Accuracy will be improved at slower heating rates (typically 2oC/min or less)
- The use of smaller and thinner samples will achieve thermal equilibrium faster (thick samples may have a significant thermal lag at higher heating rates and thus decrease accuracy)
- Monitor the temperature close to the sample with a calibrated thermocouple
- As discussed in the last post, the strain amplitude is a key experimental variable. Typical strain amplitudes are in the range of 0.1-0.3%.
- It would be prudent to run a “strain sweep” when running the DMA on a new type sample. Most commercial instruments will allow the strain to be sequentially increased over a prescribed range. Examination of a plot of modulus (i.e. E” and E”) vs. strain amplitude will indicate where the dynamic moduli are independent of strain amplitude.
- Sample geometry (sample thickness or width) can also be evaluated in order to find the optimal operating window.
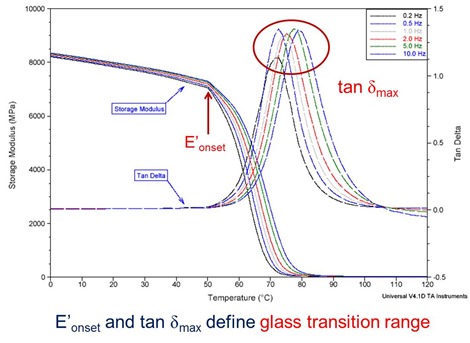
Example of Frequency Effects
In the above figure one observes that the frequency effects are most pronounced in the tan delta peaks. The magnitude of the storage modulus in the glassy region (sub-Tg) is fairly independent of frequency. The frequency effects are more pronounced in the rubbery region. As discussed in previous posts, the glass transition is actually a range. In the above figure the E’onset and the tan delta maximum define the range of the glass transition region. In the next post we will discuss the various conventions to assigning a value to the glass transition temperature.
A good reference is “Thermal Analysis of Polymers, Fundamentals and Applications” by Joseph Menczel and R. Bruce Prime, pates 387-496, John Wiley & Sons, Inc., 2009 (note this is the book by my guest blogger, Dr. R. Bruce Prime).


Leave a Reply