Guest Post by Dr. R. Bruce Prime
In the previous post we introduced the basic operating principles of TMA and illustrated the more common measurements. In this post we describe some important applications of TMA to thermosets.
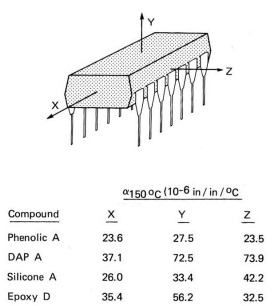
As described in the previous post TMA can quantitatively measure the coefficient of thermal expansion on samples with smooth parallel sides. Many electronic components not only satisfy this requirement in all three directions but are also small enough to be measured directly by TMA. The above results of one such study illustrate differences in both directional dependence and molding compound used [Ritchie et at., in “Thermal Analysis” (H. G. Wiedemann, ed.) Vol. 3. pp.179-185 (1972). Birkhauser, Basel]. Such measurements can be valuable in the selection of molding compounds and optimization of molding conditions. Note that the Phenolic A sample is the most isotropic and as a result would be expected to have less residual stress than the non-isotropic DAP A sample.
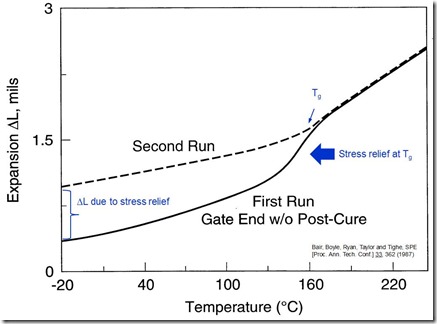
The example above illustrates the measurement of residual stress in a similar transfer molded integrated circuit device [Bair et al., Proceed. SPE An. Tech. Conf. 33, 362 (1987)]. The first run is seen to have significant information, especially when combined with the second run which, after the relaxation of internal stress, shows the classic glassy and rubbery expansion curves and measurement of Tg. In the first run the expansion rate (the slope of the expansion curve) exceeds the glassy CTE due to the slow relaxation of molded-in stress. This relaxation, reflected in the dimensional change DL, increases significantly about 30°C below Tg, showing that dimensional stability can be an issue well below the actual glass transition temperature. Stress relaxation is essentially complete by the time the temperature reaches Tg.
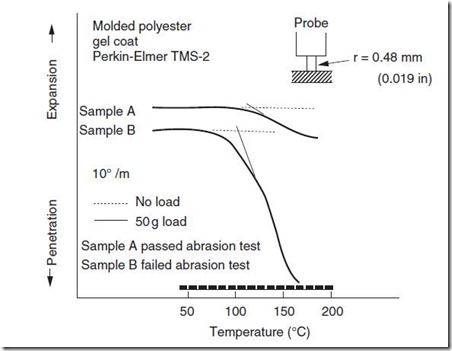
The example above shows penetration measurements on two thermoset samples, one that passed an abrasion test and one that failed [Cassel, Perkin-Elmer TAAS-19&20 (1977)]. Sample A which passed the abrasion test shows less penetration and a higher Tp. Recalling the Tg – conversion relationship this suggests that Sample A has achieved a higher degree of cure than Sample B which exhibits significantly greater penetration and lower Tp and which failed the abrasion test. TMA measurements like this can quickly distinguish differences in degree of cure that can affect functional performance.
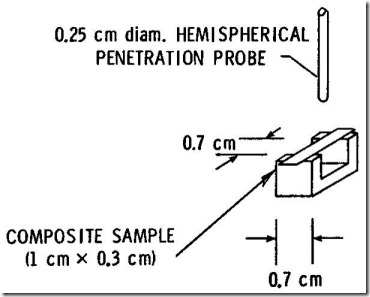
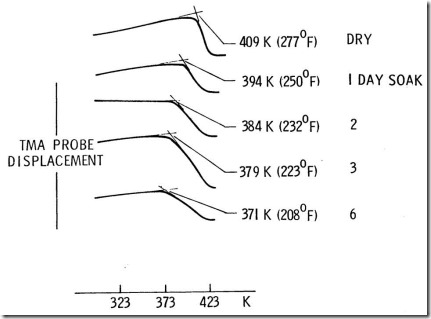
The figure above illustrates a small three-point bend fixture that will fit in a TMA [Sykes et al., Proc. Natl. SAMPE Symp. Exhib., 22nd, pp.350-364 (1977)]. This allows for a miniature heat-distortion (HDT) test (ASTM D648). The samples were two-ply unidirectional graphite-epoxy composite. Below are the results of a dry sample and samples immersed in distilled water for the times shown.
Note that after 14 days (not shown, ~1% water sorption) the HDT decreased by a whopping 49°C from 136 to 87°C. This example illustrates the ability of TMA to measure small samples and shows that small amounts of absorbed water can have large effects on mechanical properties.

Thanks for the blog posts! We are in the process of evaluating some thermoset materials. Specifically we need to measure CTE and creep of these materials. What is the best way to prepare samples? Are there molds available? Thanks for your help, Jesse
Thank you so much for the blog! Very informative. Just a quick question – for polymers that undergo stress relaxation during first heating cycle which curve should one use to get the CTE values, first curve or second curve?