While working on these posts and my book on “Thermosets,” I was going back through the literature related to the relationship of Tg and conversion and found a couple of book chapters I wrote back in 1990 [1 ,2]. As discussed in the previous two posts, in the late 1980’s there was considerable research in thermoset curing. My focus was in chemorheology since I was working on the fundamentals of advanced composite processing (i.e. lamination of complex multilayer circuit boards for IBM mainframes).
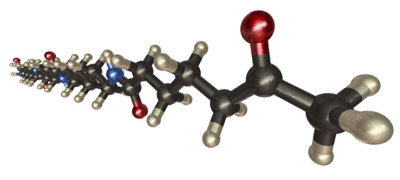
In this study, Dow Quatrex 5010 epoxy resin was used. Quatrex 5010 is based on tris(hydroxyphenyl) methane epoxy and a brominated bisphenol A hardener. The resin was catalyzed with 0.3 phr of 2 methyl imidazole (2MI). The fully cured Tg (Tg∞ ) was found to be 180°C by DSC measurements. Prepreg was fabricated using standard solvent impregnation methods where a woven E-glass fabric was impregnated with the resin catalyzed resin solution. A four-zone treater tower was used to control the solvent evaporation in the first two zones and to control the degree of B-stage advancement in the second two zones. The resultant woven glass material was a non-tacky, boardy type of prepreg.
For the rheological and DSC analysis, resin powder was obtained by shaking the B-stage epoxy resin from the glass fabric. Extraneous broken fibers were removed by a fine mesh sieve. The resultant B-staged powder was molded at 95°C into 25.4 mm diameter disks at a thickness of 1.5 mm using a vacuum mold. The Tg of the B-staged resin was measured to be 57°C using DSC. The molding process at 95°C was verified by DSC to not advance the B-staged epoxy resin.
Rheological measurements were conducted using a Rheometrics System Four rheometer (oh my gosh, only the oldies reading this post will remember the System Four behemoth). The rheometer had a temperature controlled environmental chamber that was purged with nitrogen. The rheological measurements were made in the parallel plate mode at a 2% strain amplitude at 6.3 rad/sec (1 Hz). Aluminum disposable plates were used to allow quick sample removal during the aborted rheology runs. A thermocouple was also embedded in bottom aluminum plate allowing direct measurement of the sample temperature during the non-isothermal rheology profiles.
Figure 1 shows a schematic of the procedure used for the “aborted” rheology runs.
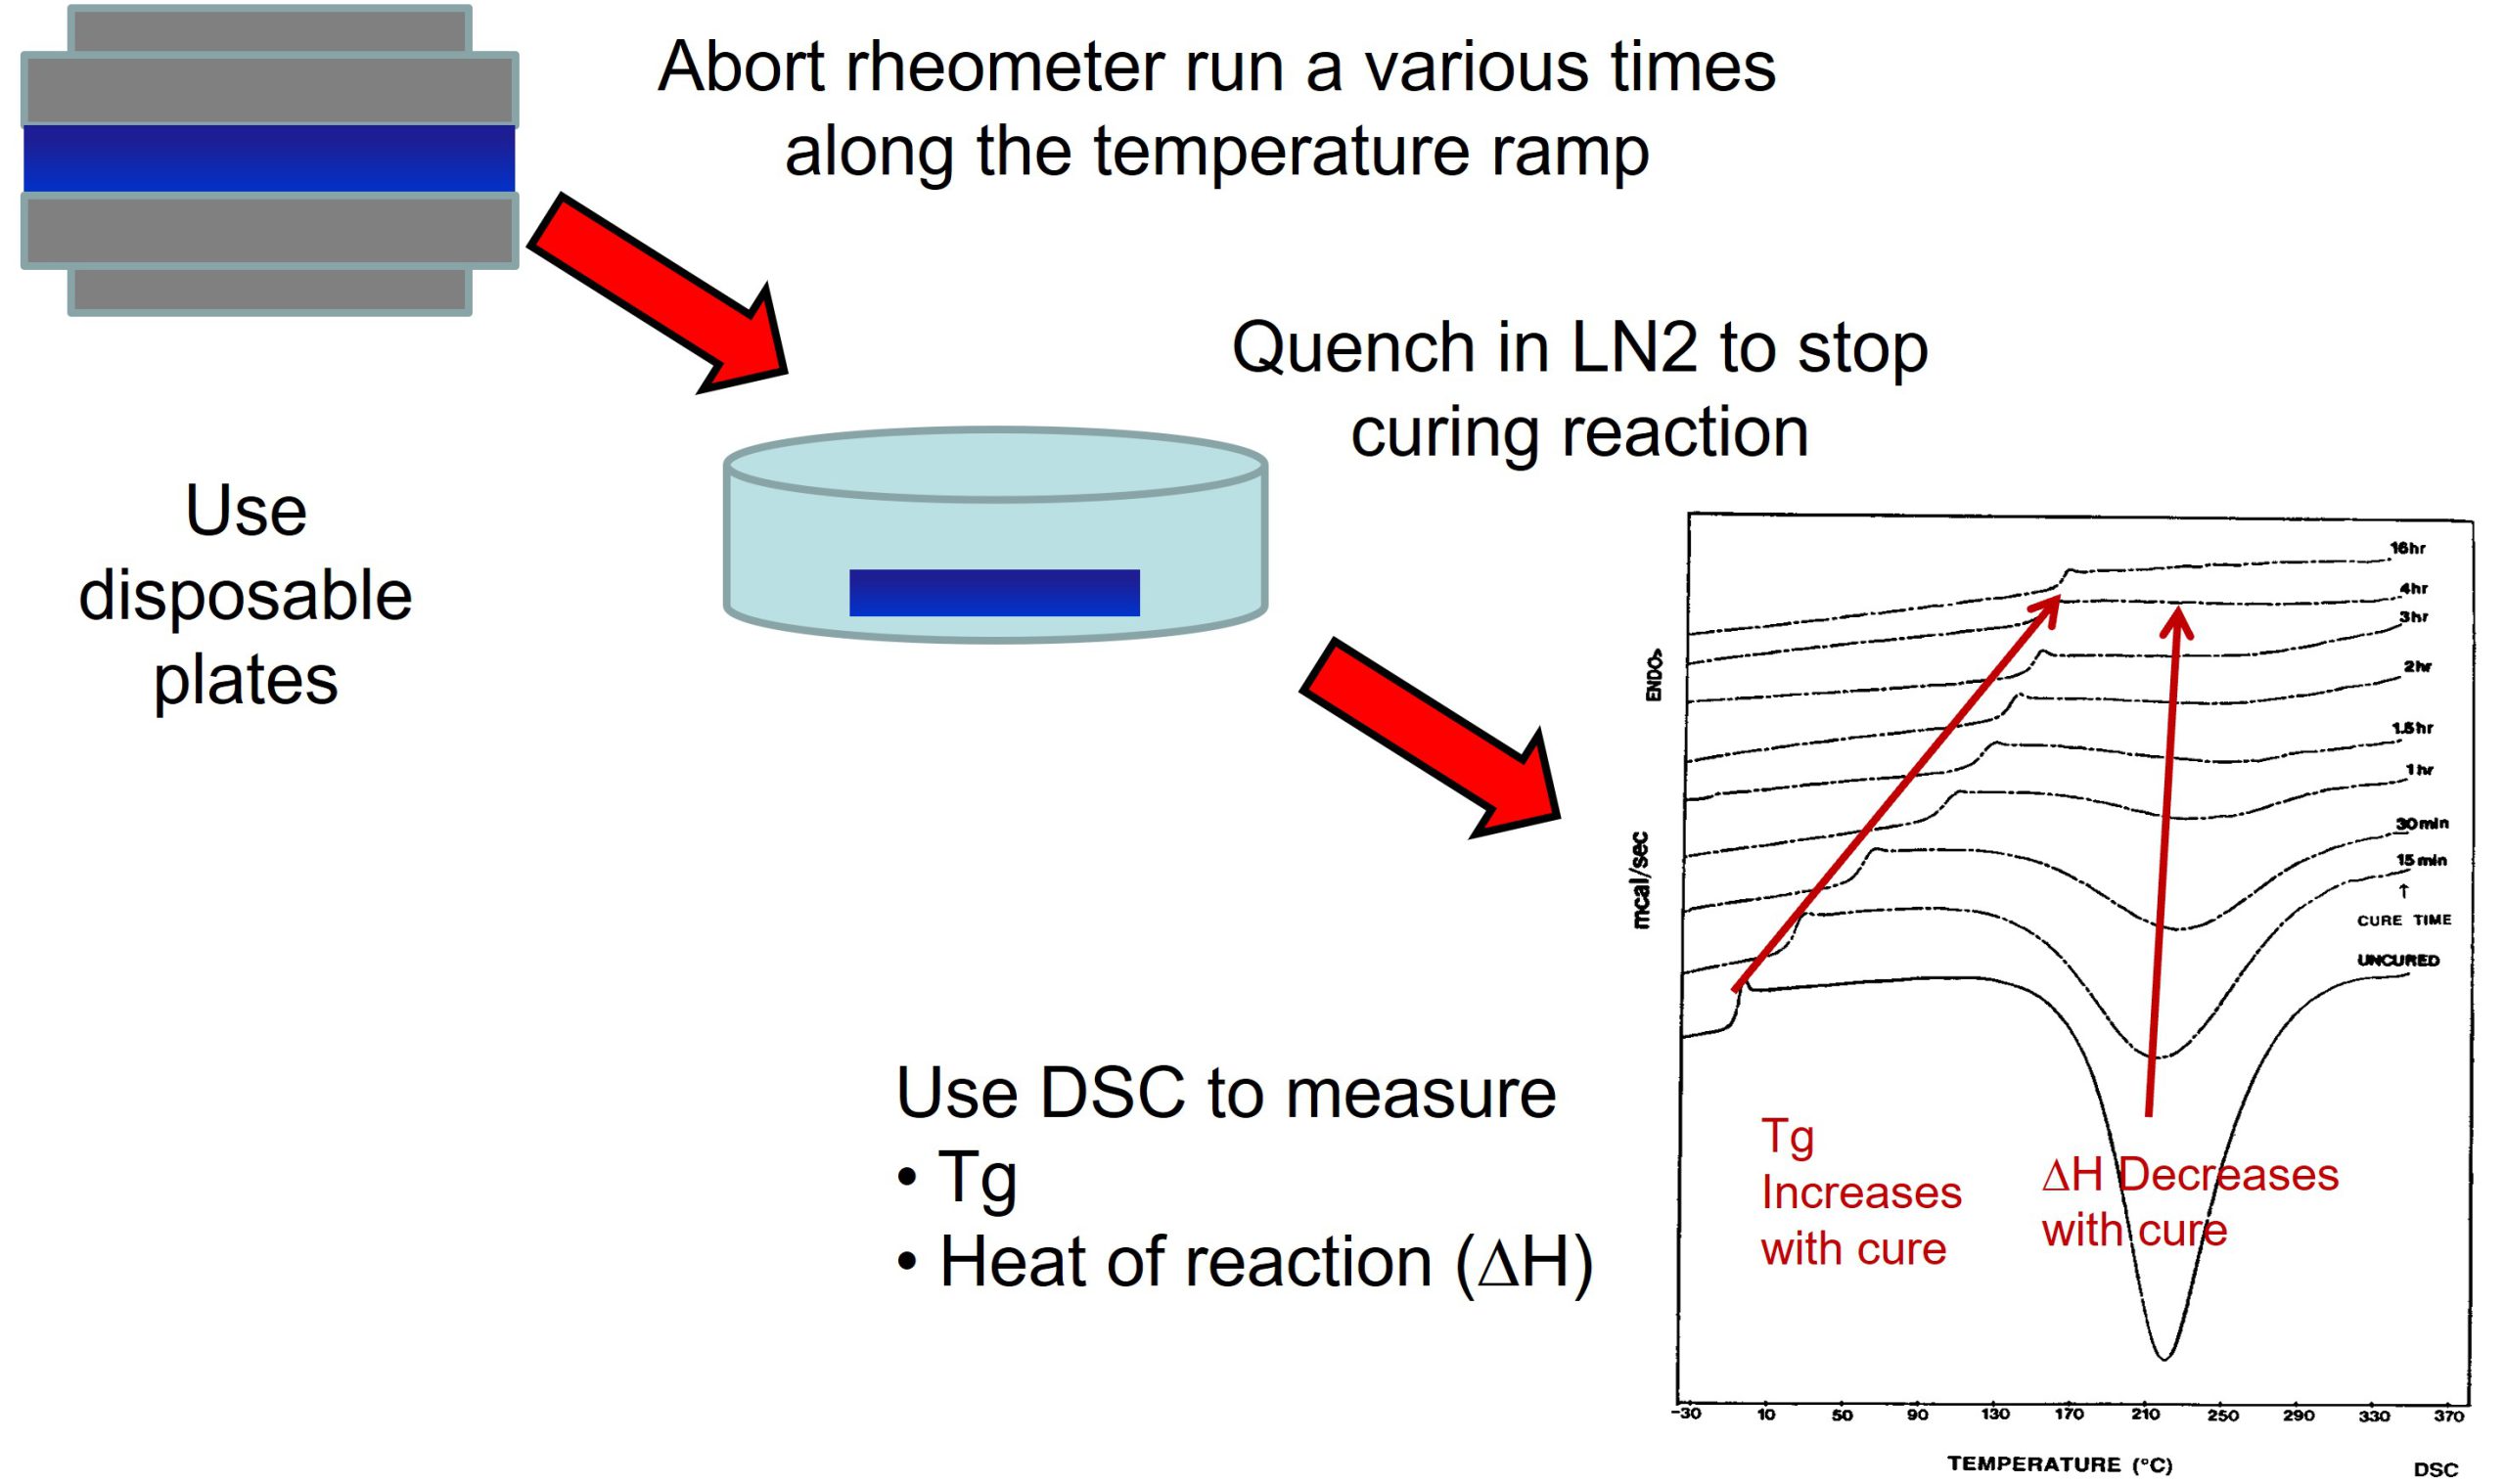
Figure 1. Procedure for “aborted” rheology runs during non-isothermal curing [1].
The goal of the work was to investigate how the Tg and fractional conversion (or percent conversion) was related to the viscosity profile during controlled heating ramps to 175°C. For each sample during the aborted rheology runs, a DSC scan was performed to measure the Tg and the residual ΔH. The fractional conversion was measured using the equation presented in the last post and shown in Figure 2.
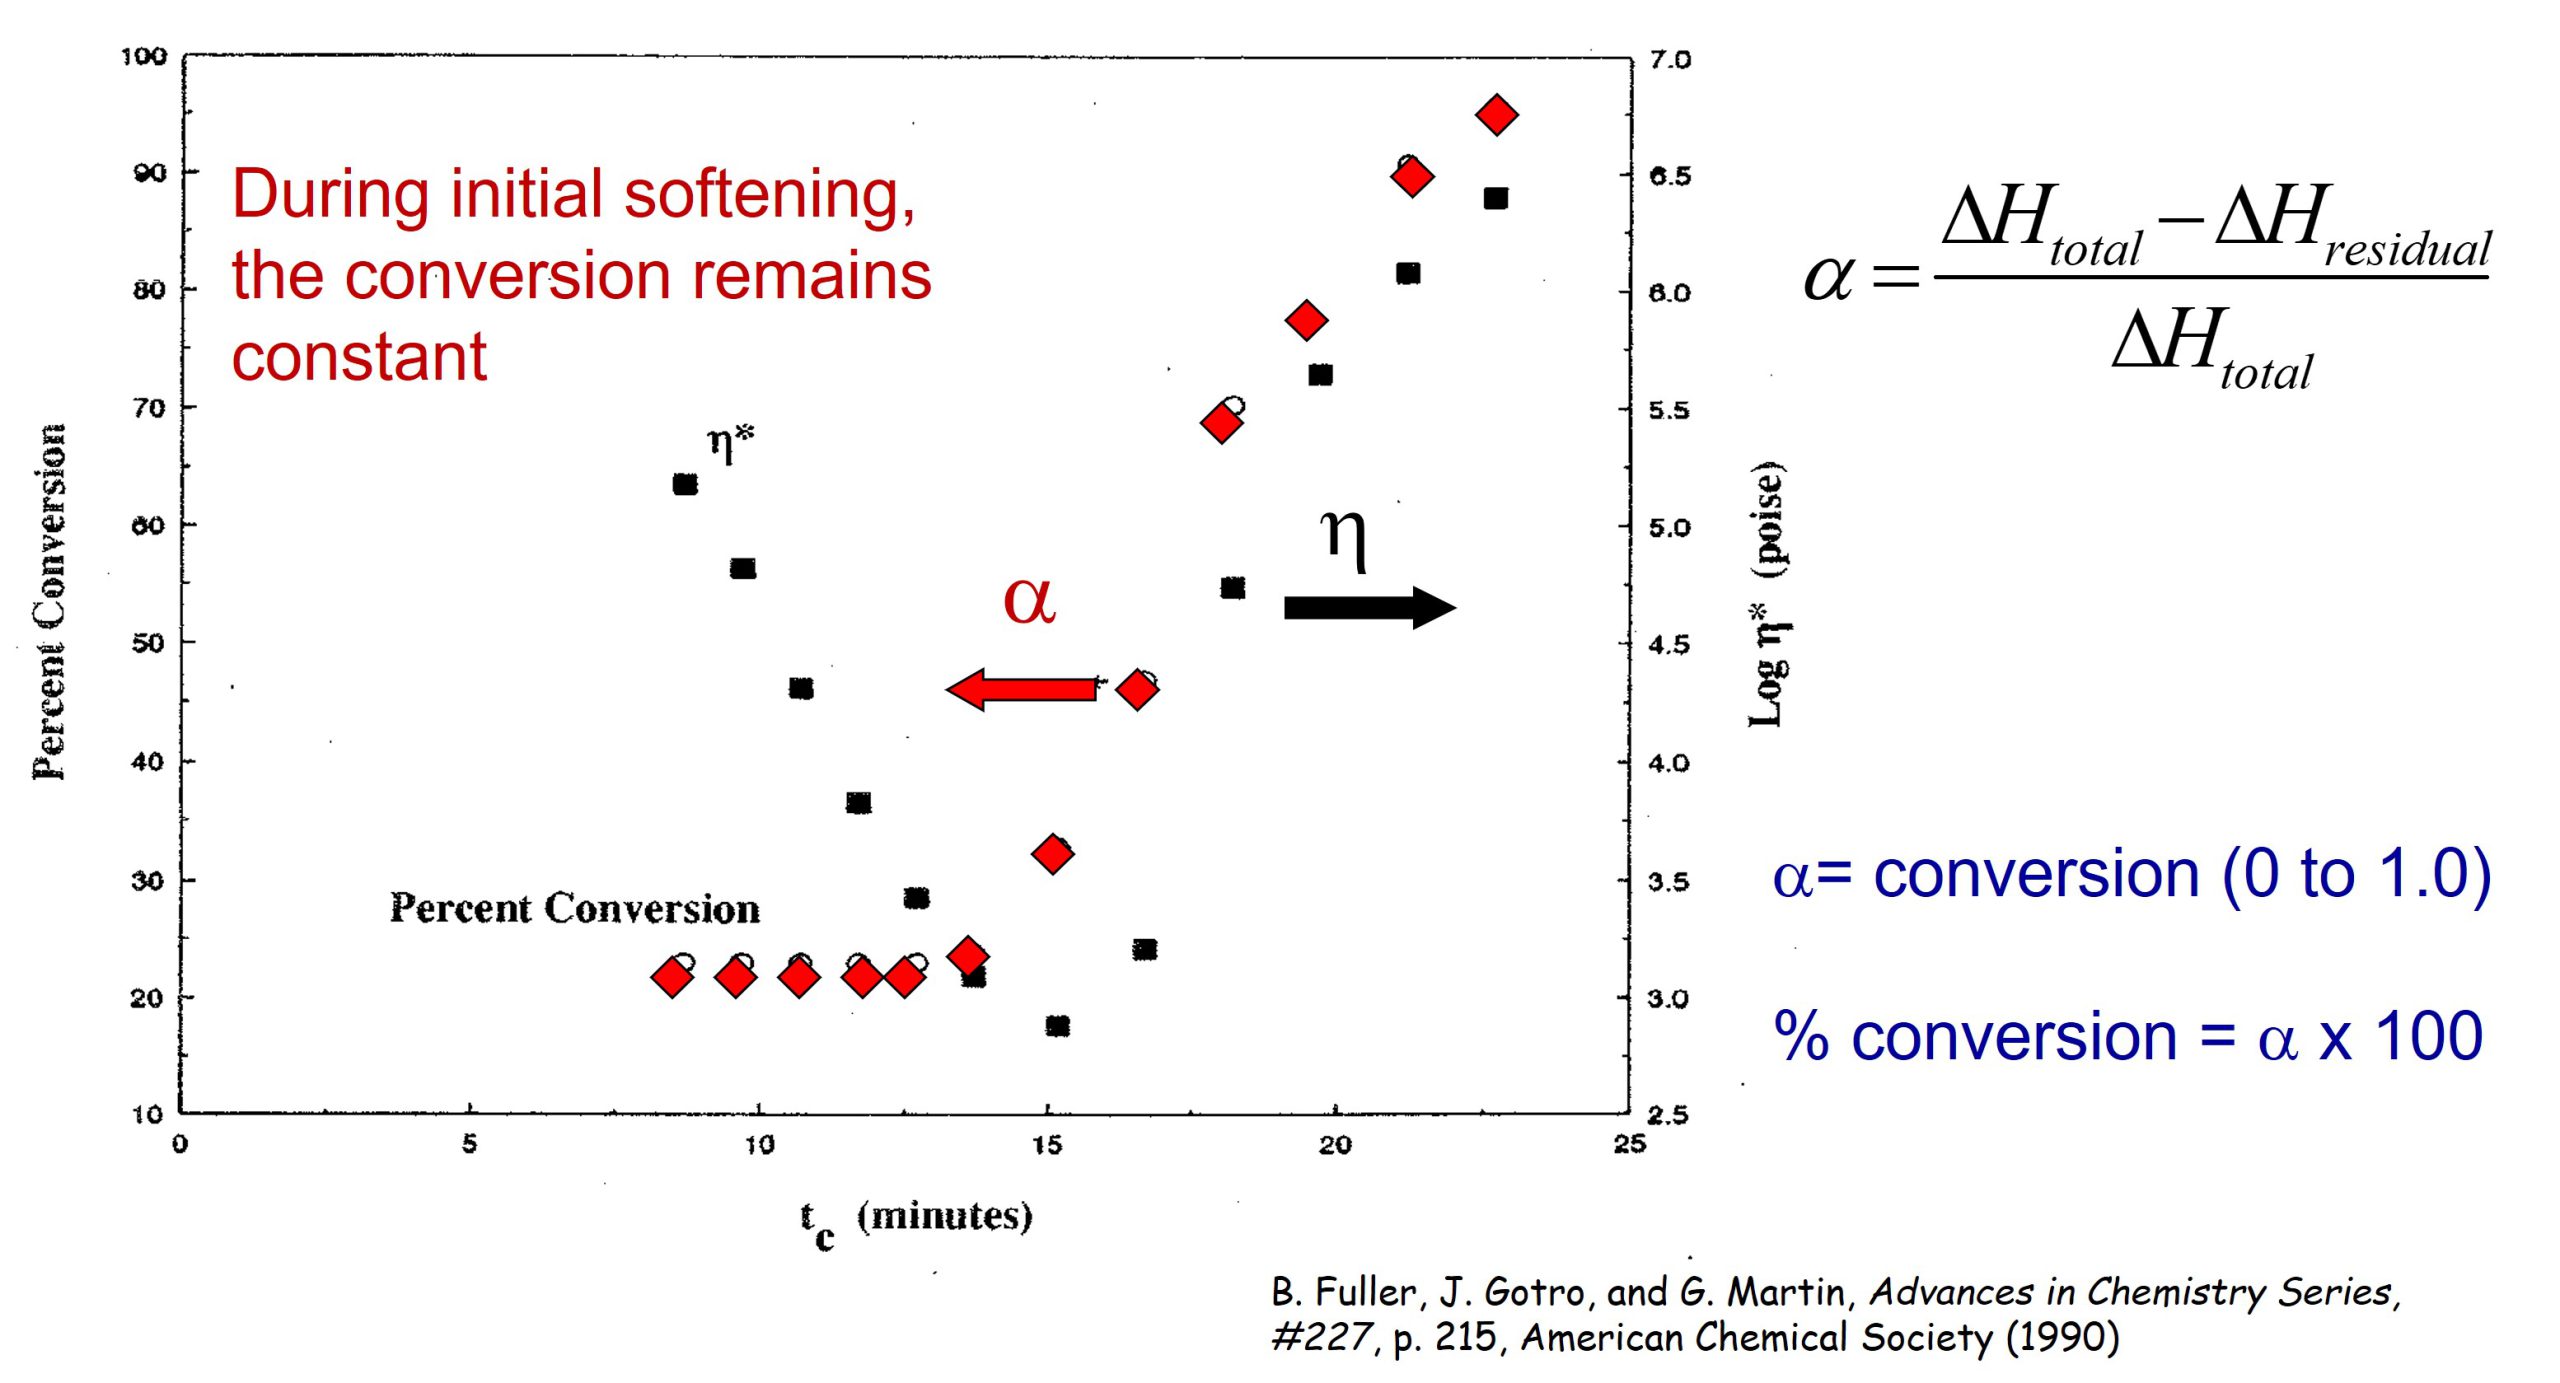
Figure 2. Percent conversion (α) and complex viscosity during a controlled heating rate of 9.8°C/minute to a cure temperature of 175°C [1].
In Figure 2, the percent conversion is plotted as a function of time on the left axis and the viscosity is shown on the right axis. Remember, the percent conversion is how many reactive groups have been consumed during curing. In Figure 2, the material was B-staged, so one observes the conversion to be approximately 23% (i.e. 23% of the total reactive groups have already reacted).
In Figure 2, each pair of data points represents a rheometer run that was allowed to proceed for successively longer times. Remember, at each viscosity data point (black squares) after the viscosity was measured, the run was aborted, the sample quenched, and subsequently run in the DSC to measure conversion and Tg. It is obvious that the chemical curing reaction is not taking place during the initial viscosity decrease since the conversion remains constant. The chemical reaction is controlled by the use of a latent catalyst that allows the resin to soften and flow in the press before the curing reaction starts. The conversion starts to rapidly increase prior to the minimum viscosity since there are two competing physical phenomena occurring:
- Viscosity decreases due to the increasing temperature
- Viscosity increasing due to the curing reaction
When the molecular weight increases (i.e. viscosity increases) due to the chemical reaction, the viscosity goes through a minimum and then rapidly increases.
In Figure 3, the viscosity and glass transition temperature (Tg) are plotted as a function of time for the same set of aborted rheometer runs.
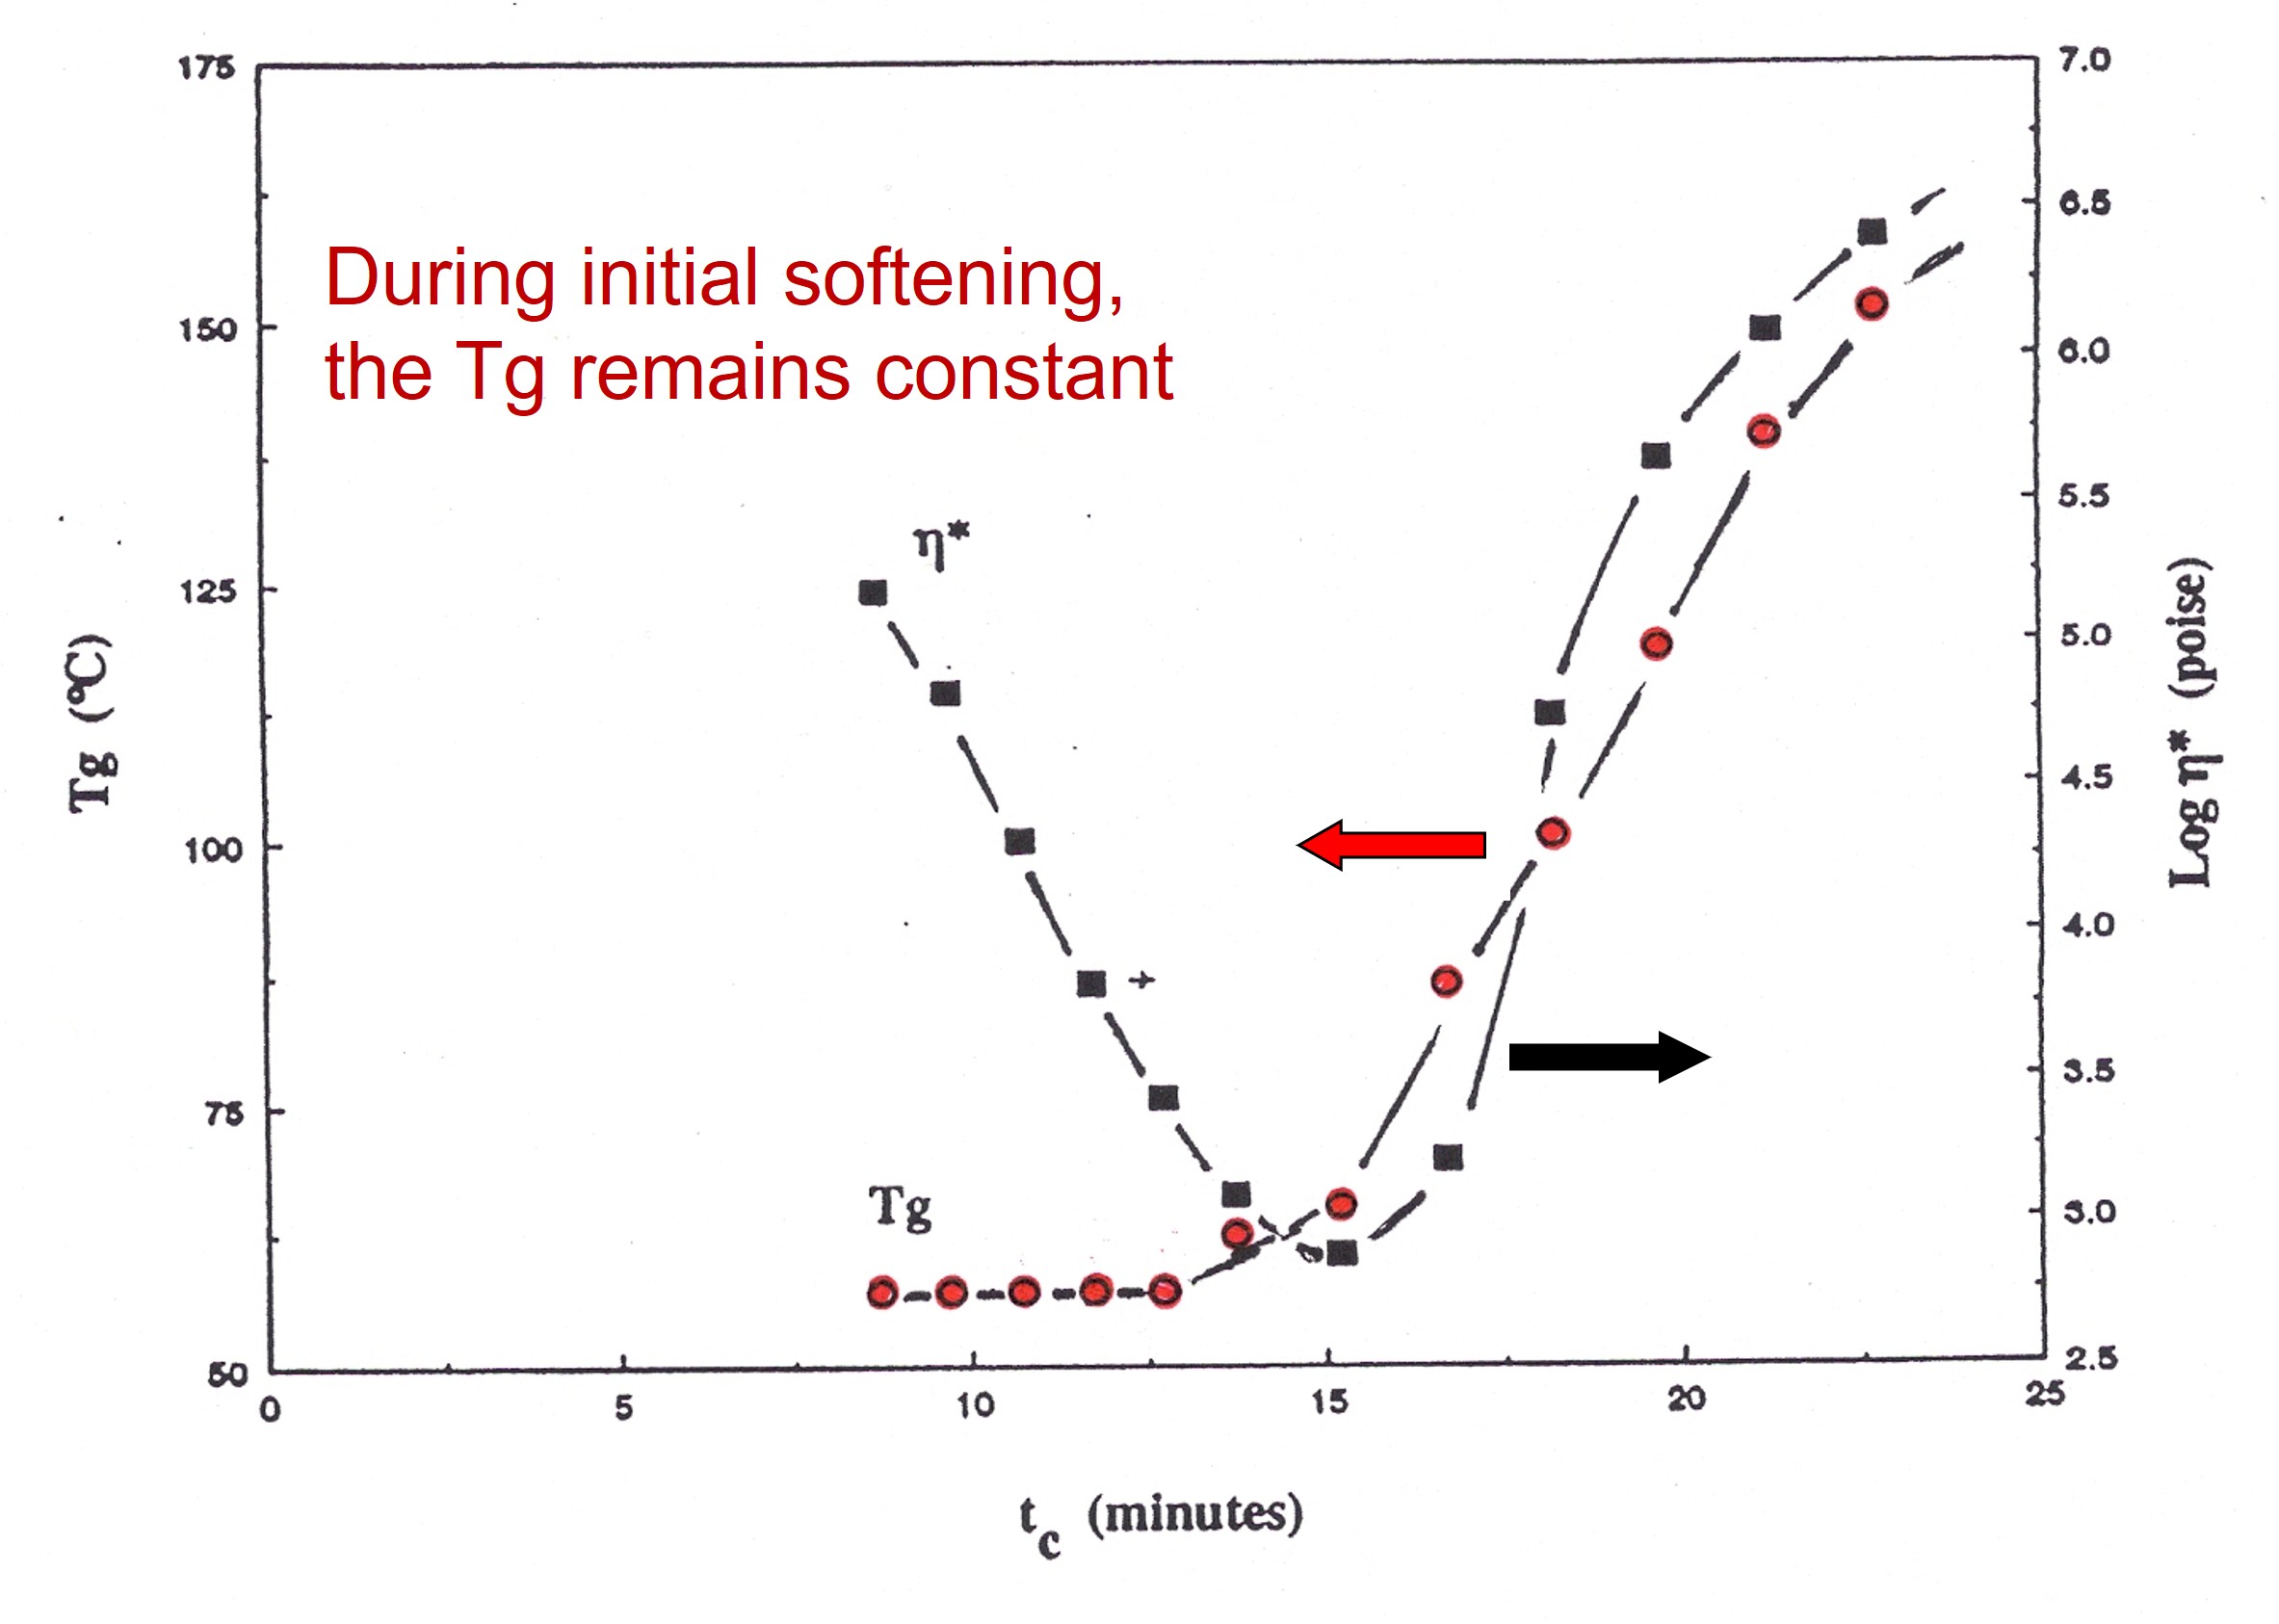
Figure 3. Glass transition temperature (Tg) and complex viscosity during a controlled heating rate of 9.8°C/minute to a cure temperature of 175°C [1].
As was observed with the conversion data, the Tg remains constant during the decrease in viscosity, then rapidly increases due to the curing chemistry.
The heating rate can be used to tailor the viscosity window, with faster heating rates to the cure temperature causing a narrower flow window and lower minimum viscosity, while slower heating rates result in a wider flow window with a higher minimum viscosity. Selecting the appropriate latent hardener/catalyst system then allows the resin to soften and flow prior to rapid crosslinking. By understanding the roles of curing chemistry and the physics of the effect of heating rate, the process can be optimized to achieve both good flow and full cure.
In the data presented in Figures 2and 3, the heating rate was 9.8°C/minute. Additional experiments at several heating rates exhibited similar data in terms of how the Tg and conversion remained constant during the initial viscosity decrease and then rapidly increased as the chemical curing reactions proceeded [1].
In addition to the non-isothermal tests described in Figures 1-3, additional Tg and conversion data was obtained curing isothermal curing at 127, 137, 148, 159, and 170°C. At specified time intervals at each isothermal temperatures, DSC samples were taken and analyzed for Tg and ΔHresidual .
In Figure 4, Tg is plotted as a function of percent conversion (fractional conversion times 100).
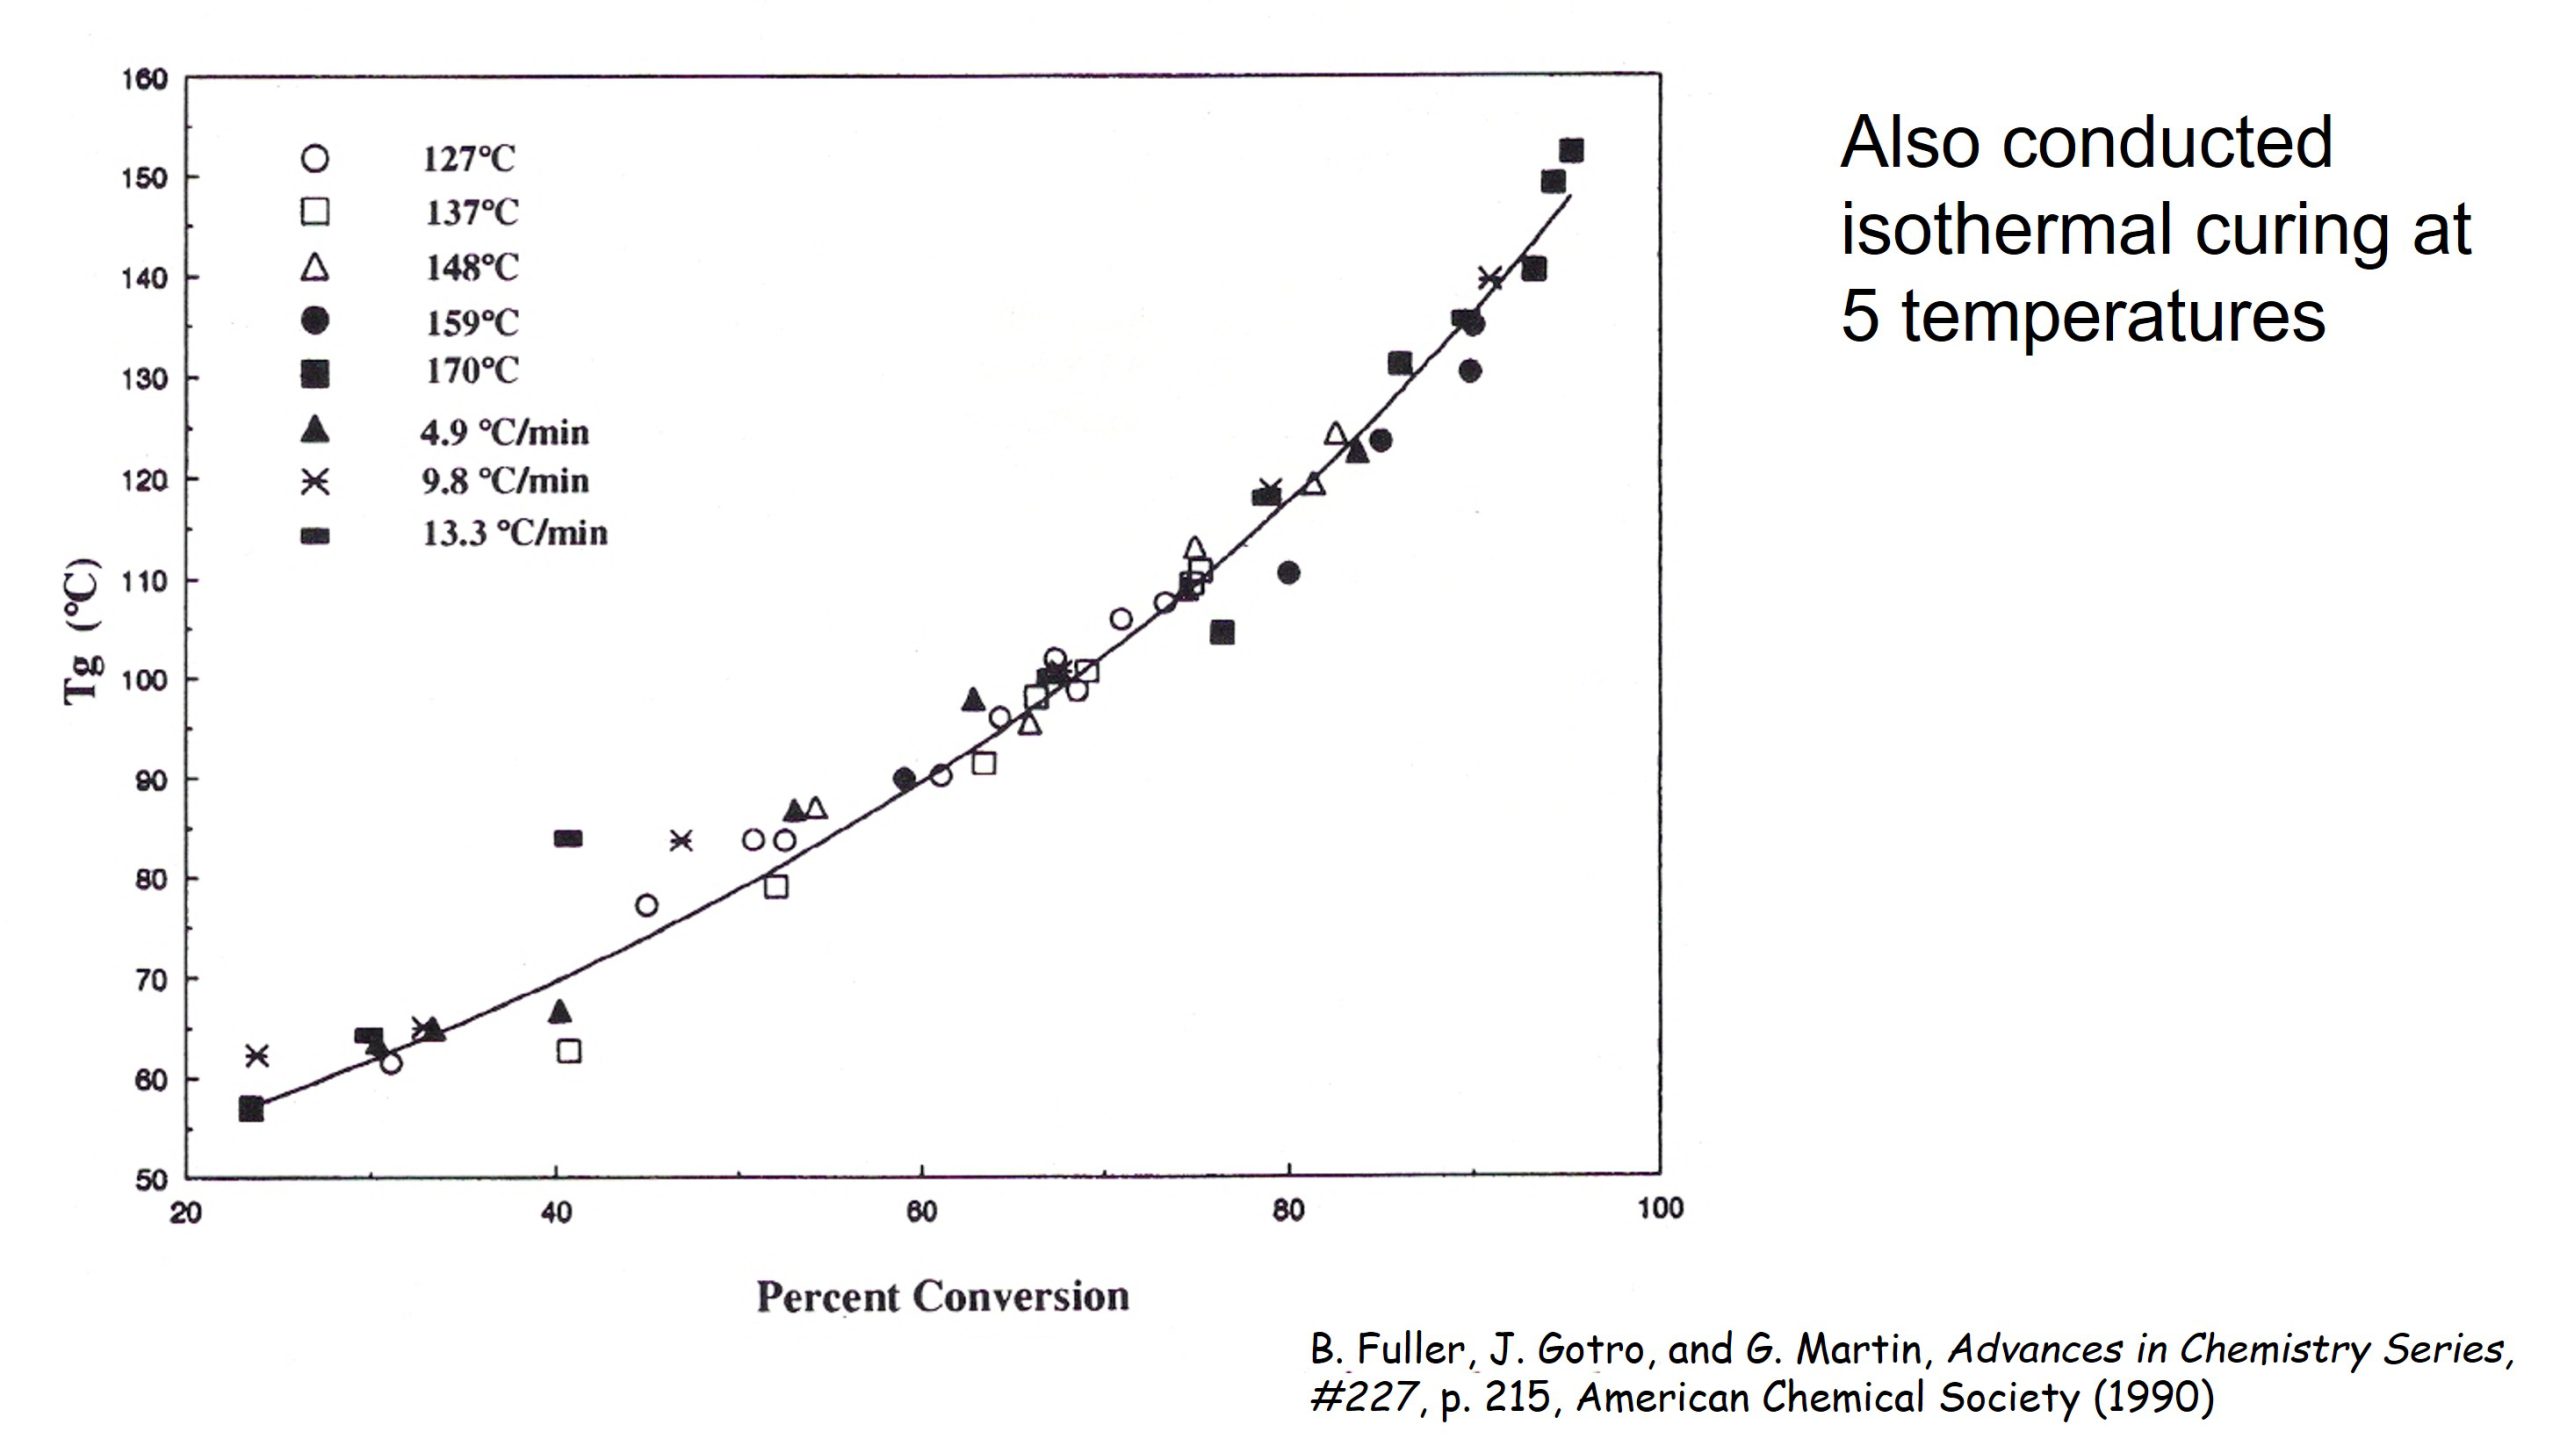
Figure 4. Glass transition temperature (Tg) as a function of percent conversion for both aborted rheology runs and isothermal cure [1].
The data in Figure 4 falls on a single curve. The significance of this is that the curing is “cure path independent” meaning the Tg – conversion relationship will be the same for either isothermal or non-isothermal curing. Additionally, as we observed in the extensive work by Professor John Gillham and his students [3, 4] that this type of Tg/conversion relationship occurs in thermosetting polymers. From a process standpoint, to ensure that the thermoset resin system is fully cured, achieving a conversion significantly higher than 90% is required. The solid line in Figure 4 is the DiBenedetto equation and will be covered in the next post along with additional Tg/conversion data from different thermoset systems.
References:
- Fuller, J. Gotro, and G. Martin, “Analysis of the Glass Transition Temperature, Conversion, and Viscosity during Epoxy Resin Curing,” Advances in Chemistry Series, No. 227, in Polymer Characterization: Physical Property, Spectroscopic, and Chromatographic Methods, Clara Craver and Theodore Provder, Editors, page 215, 1990, American Chemical Society.
- Martin, A. Tungare, and J. Gotro, “Modeling the Rheological and Dielectric Properties during Thermoset Cure,” Advances in Chemistry Series, No. 227, in Polymer Characterization: Physical Property, Spectroscopic, and Chromatographic Methods, Clara Craver and Theodore Provder, Editors, 1990, American Chemical Society.
- Wisanrakkit, G. and Gillham, J. K., Journal of Applied. Polymer Science, 41, 2885 (1990).
- Wisanrakkit, G. and Gillham, J. K., Journal of Applied. Polymer Science, 42, 2453 (1991).
Leave a Reply