Over the years it has become apparent that an often mis-understood concept is how the fractional conversion (or percent conversion) plays a large role in the development of the glass transition temperature (Tg) during curing. The question is why? For many reasons it is important to keep current on scientific literature in your field. But what if the important stuff was buried in the literature decades ago?
It turns out that a seminal paper by Professor John Gillham and one of his Ph.D. students was published in 1990 that very clearly articulated the concept of how the fractional conversion impacts the glass transition temperature during curing. See Wisanrakkit, G. and Gillham, J. K., Journal of Applied. Polymer Science, 41, 2885 (1990). Figure 1 is the Tg versus fractional conversion calculated using the residual heat of reaction from differential scanning calorimetry (DSC) measurements.
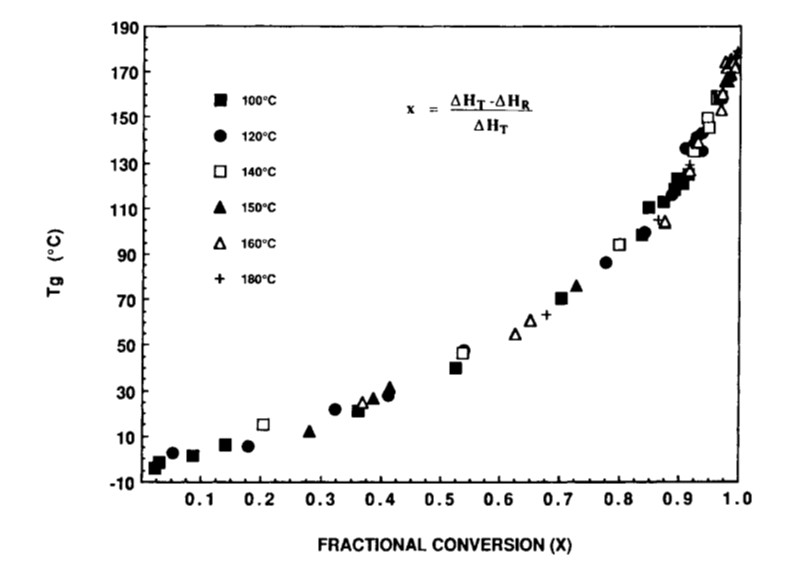
Figure 1. Tg is plotted as a function of fractional conversion from reference [1]. Reproduced with permission of John Wiley and Sons.
In terms of a DSC measurement the conversion or degree of cure at time t (αt,DSC) is defined as:
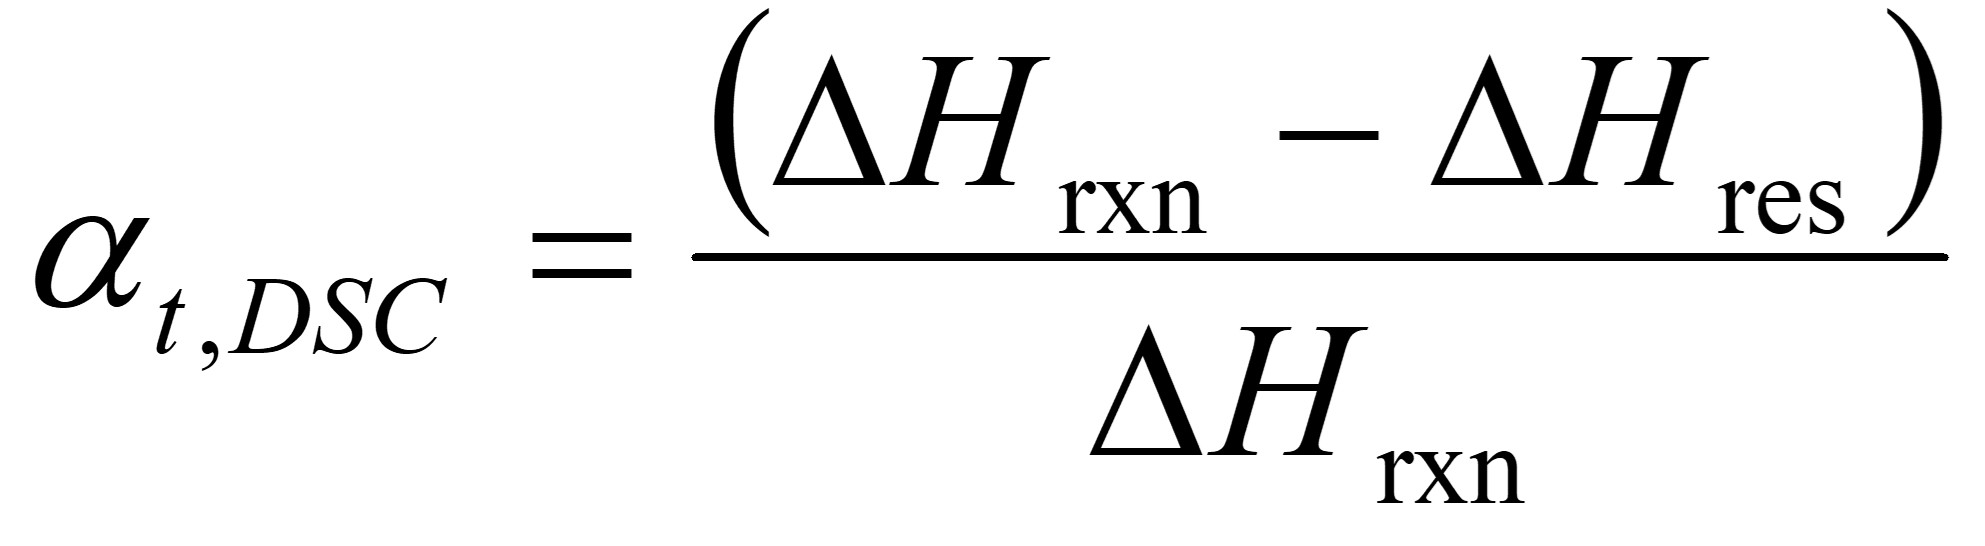
where ΔHres is the residual heat of reaction at time t, and ΔHrxn is the total heat of reaction of the unreacted thermoset mixture.
The first feature to notice is the shape of the plot. The initial slope is shallow, indicating Tg is increasing slowly as the curing reactions progress. The data in Figure 1 is for an epoxy amine system [1]. During the first stages of curing, the 4-functional amines start to open the epoxy rings leading to chain extension and an increase in the molecular weight. At this point in the curing there will be low amounts of crosslinking.
The Tg versus conversion data in Figure 1 was obtained using a difunctional epoxy (DGEBA DER 332), CAS 1675-54-3 and a four functional amine, trimethylene glycol di-p-aminobenzoate (TMAB) CAS 57609-0).
The gel point is easily calculated if the functionality of the epoxy and amines are known [from Flory, 2, 3]
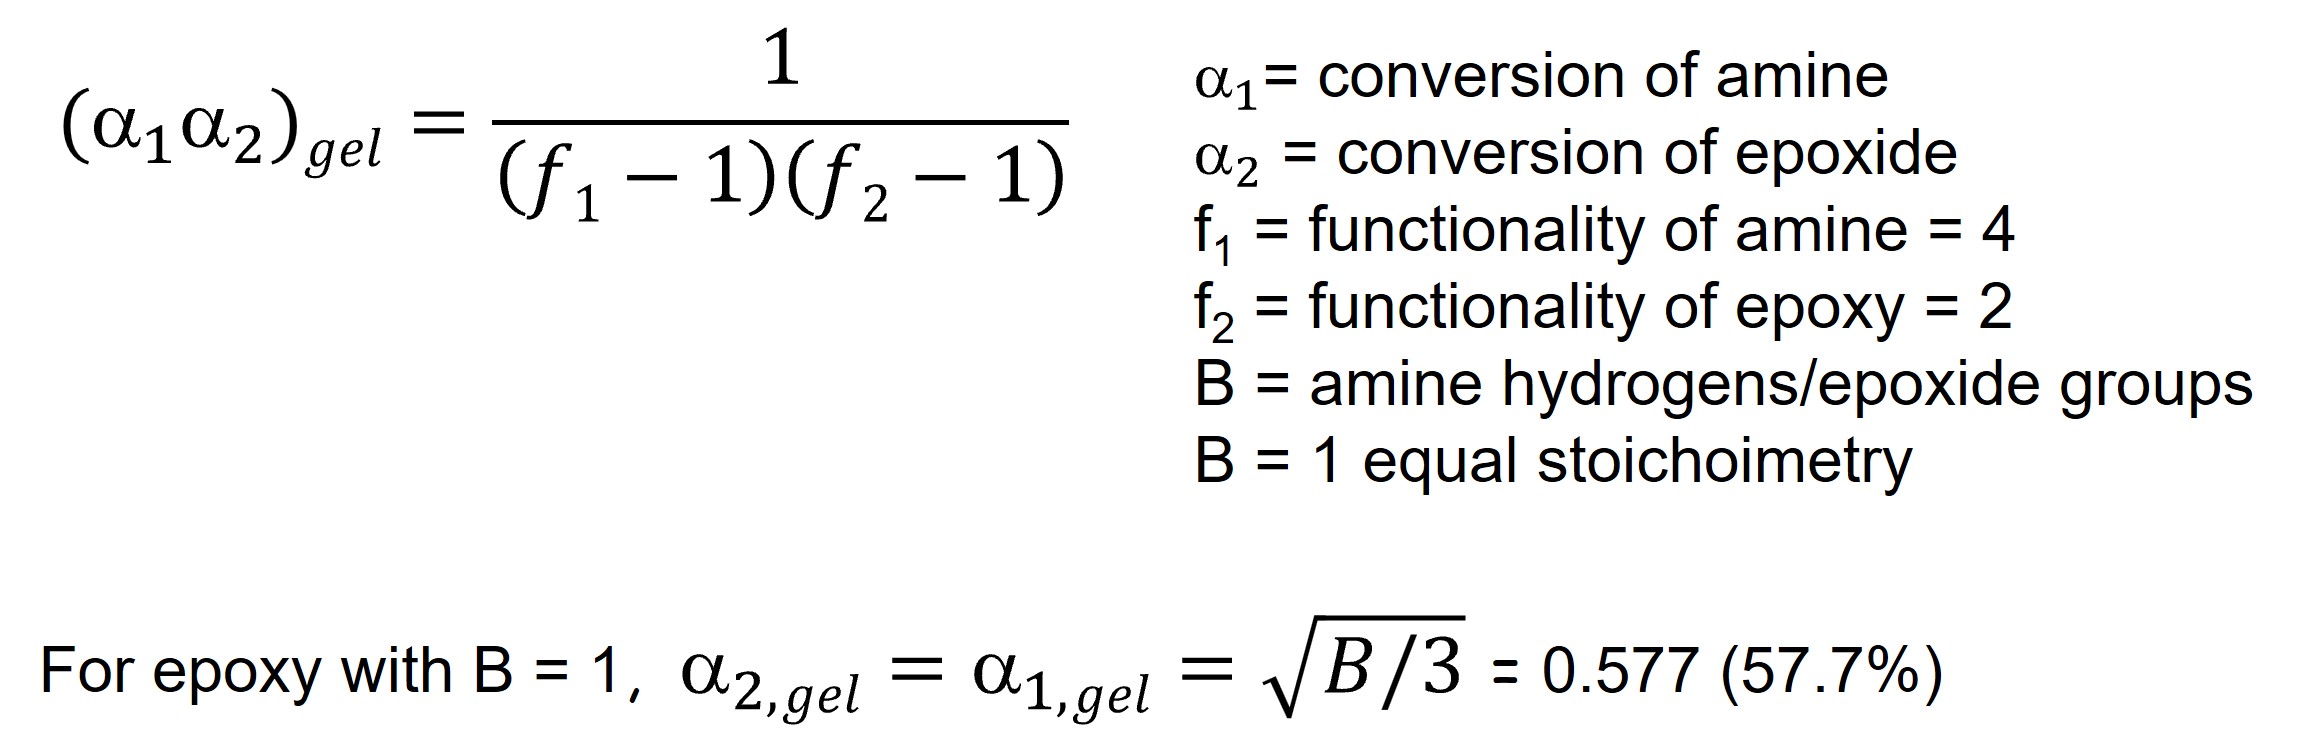
In Figure 2, I have annotated the original plot to show the conversion at the gel point.
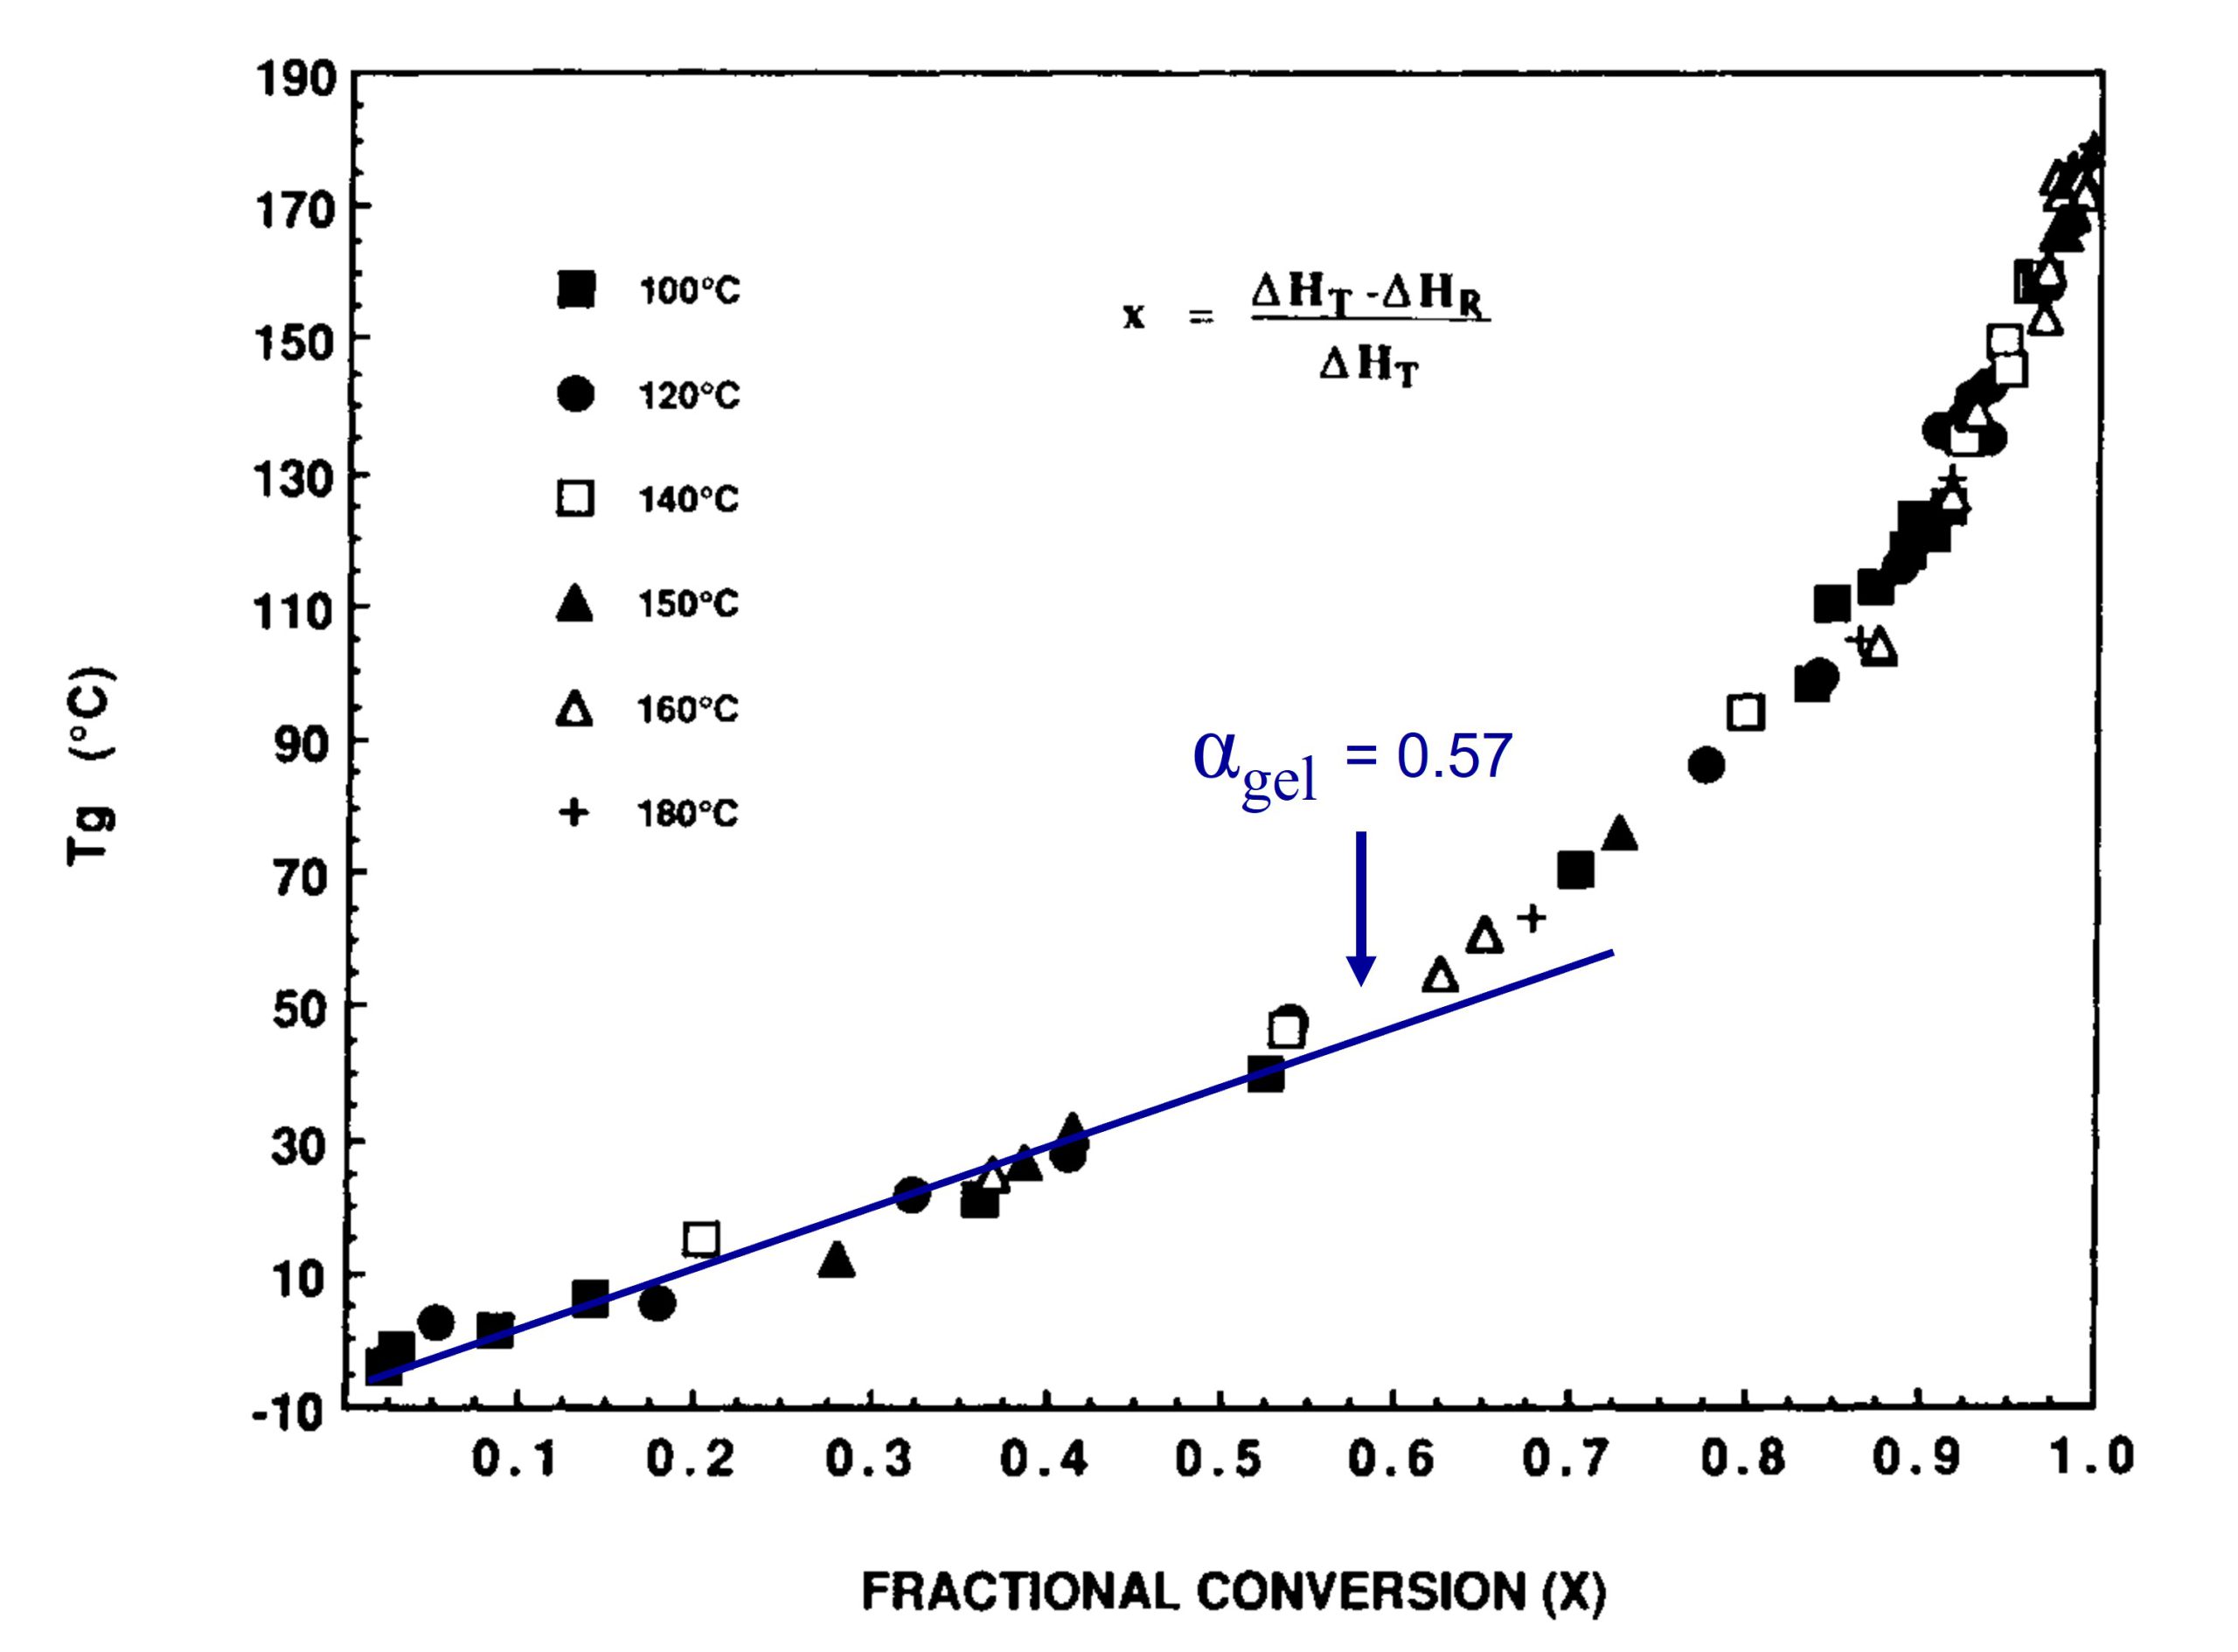
Figure 2. Tg is plotted as a function of fractional conversion adapted from reference [1]. Reproduced with permission of John Wiley and Sons.
In Figure 2, the fractional conversion at the gel point (0.57) is noted and I added the blue line to highlight that Tg increases linearly with conversion in the early stages of cure. Generally, for typical epoxy-amine systems, gelation occurs in the range of 35-60% conversion depending on the stoichiometry. Note that the Tg at the gel point is still low for the data in Figures 1 and 2. As the amines continue to react with the growing epoxy chains, additional crosslinking will increase Tg more rapidly. In Figure 2, note the slope increases at conversions higher than the gel point indicating crosslinking reactions are increasing the chain stiffness, i.e., increasing the Tg. The most important feature in Figures 1 and 2 is the very rapid increase in the Tg at fractional conversions greater than 0.8 (80% conversion). For the data in Figures 1 and 2, the fractional conversion increases at a rate of 5.4°C/fractional conversion in the range of 0.9 – 0.99 (90 to 99% conversion). The data indicates the Tg increases by approximately 54°C between 90 and essentially full conversion. The shape of the Tg-conversion plots is universal for many polymer systems which I will discuss in Post 3 in this series. The practical implication of the Tg-conversion plot is significant in that one must design a thermoset curing or molding process to achieve a very high degree of conversion to obtain the desired final cured properties.
In a second paper, Wisanrakkit and Gillham showed you could build the Tg – conversion plot using torsional braid analysis (TBA) to measure the Tg. The Tg data in Figure 3 was obtained using TBA and DSC was used to calculate the fractional conversion.
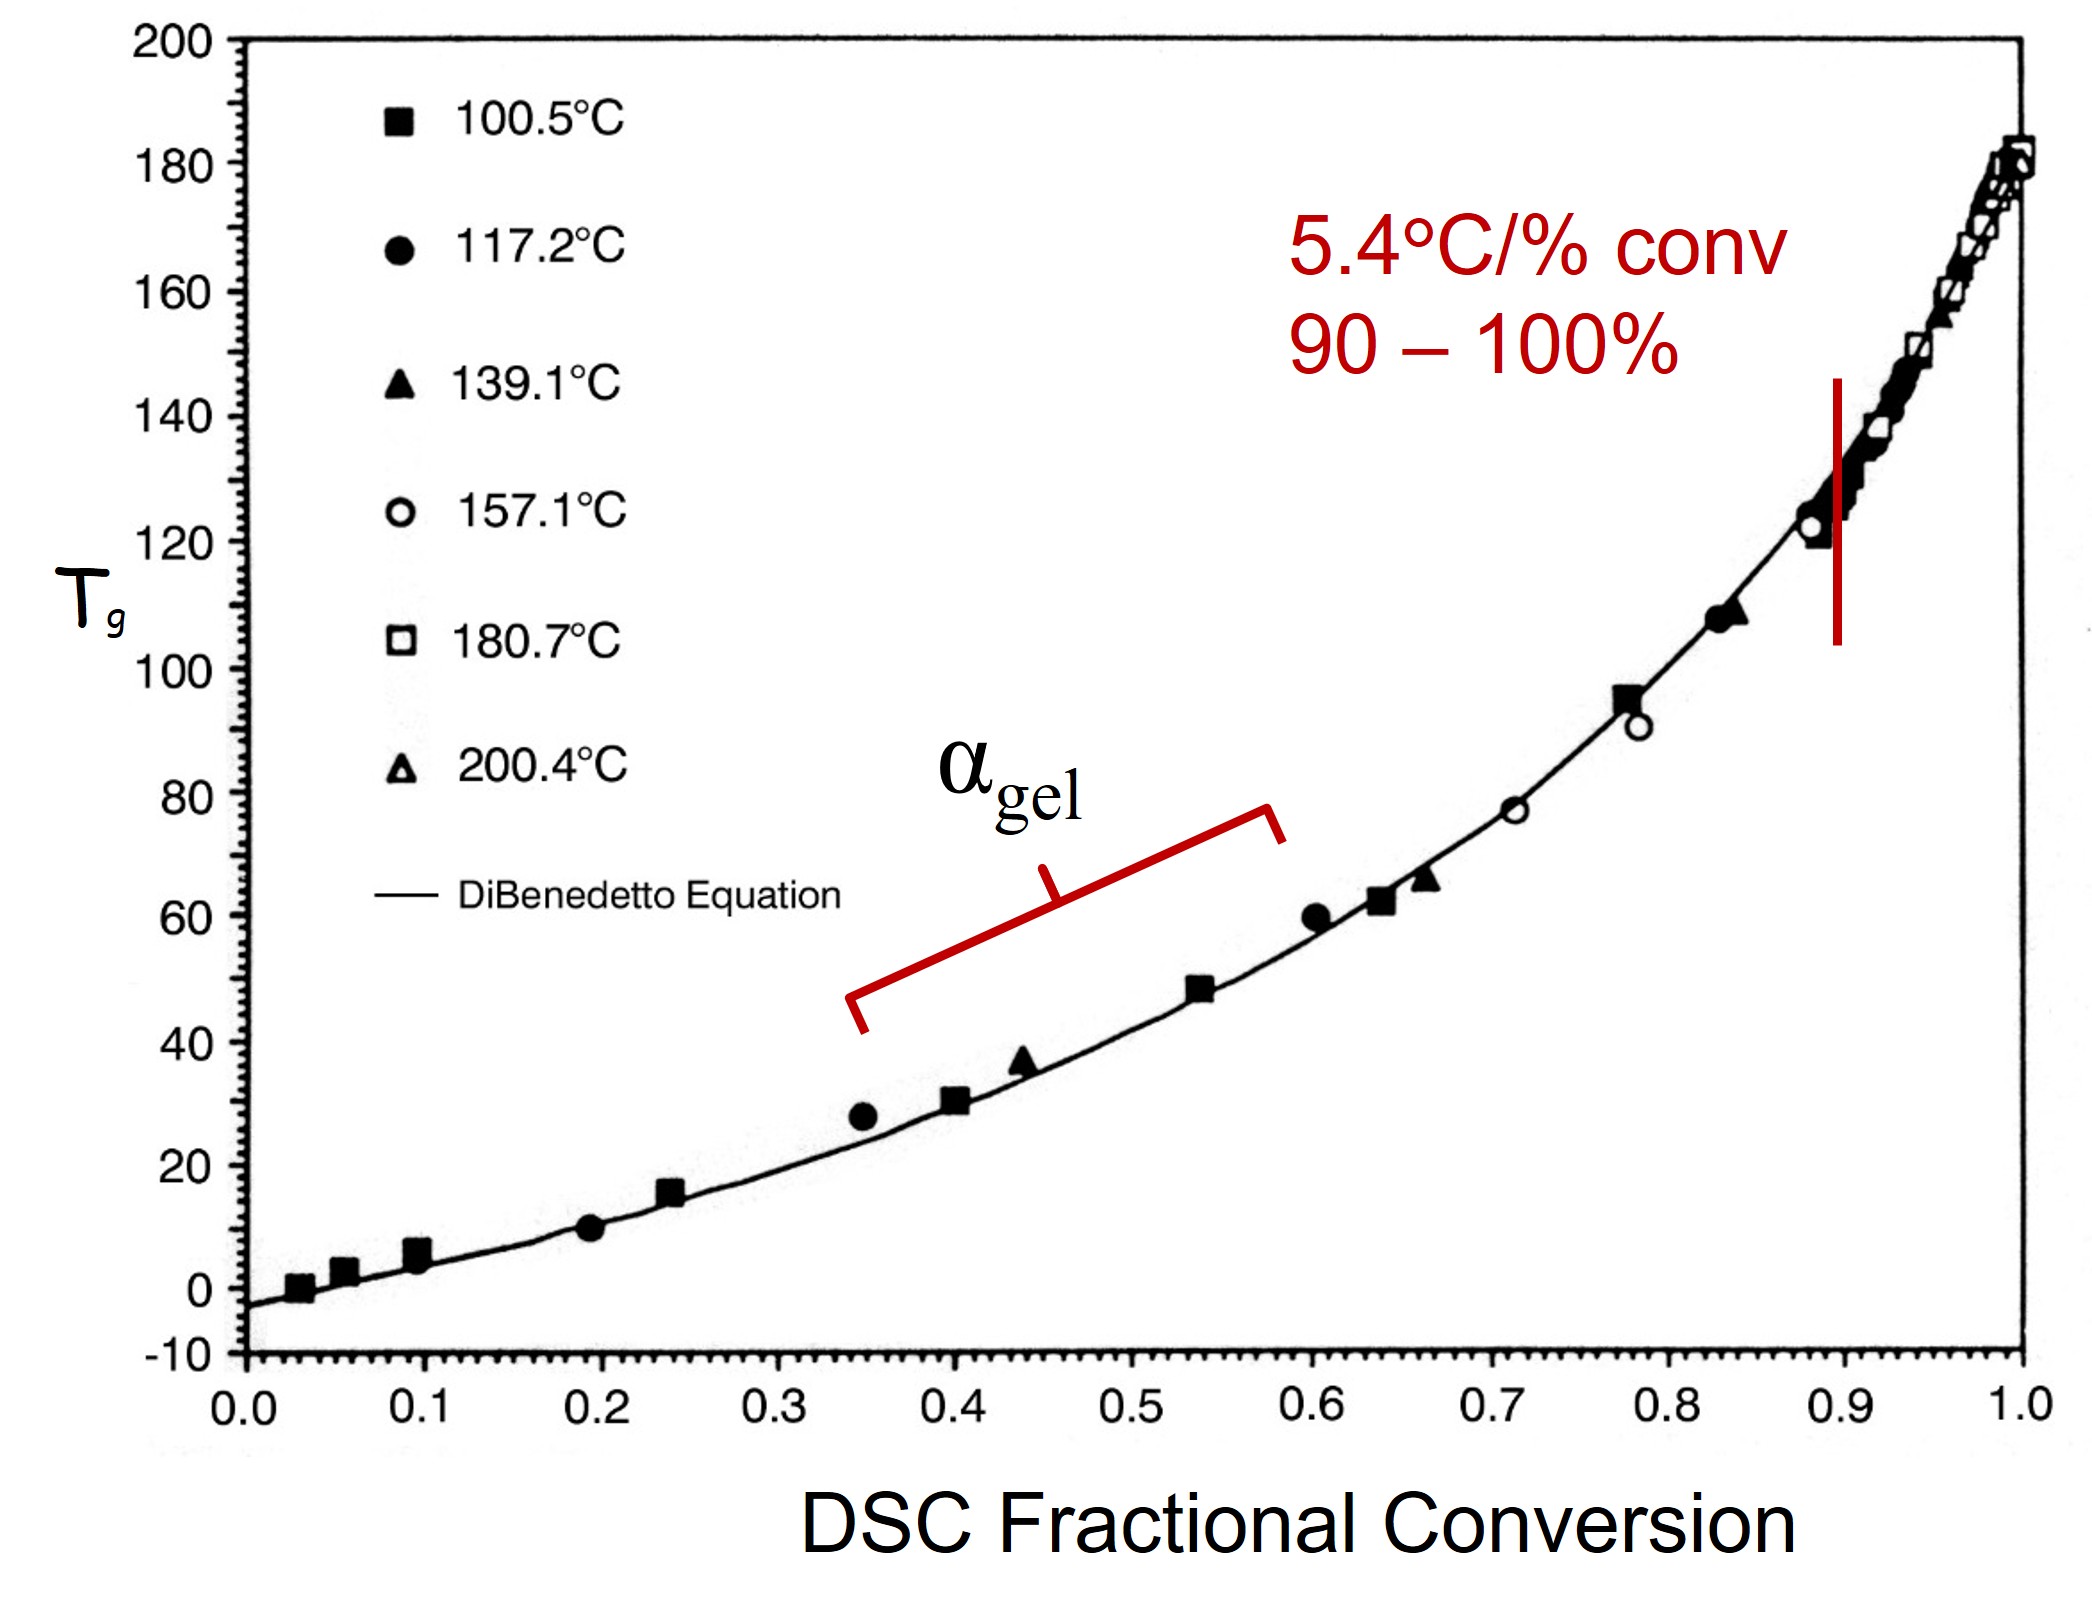
Figure 3. Glass transition temperature (Tg) measured using Torsional Braid Analysis (TBA) versus DSC fractional conversion annotated from reference [4]
The most important feature in Figure 3 is that the Tg increases over 50ºC from 0.9 to essentially 1.0 fractional conversion (or 90 to about 100% conversion). The Tg rapidly increases as the final crosslinks tighten the network by linking the growing crosslinked network into a large infinite molecule. Note that at 90% conversion, the Tg is not close to the fully cured Tg∞ of 178ºC [1].
There are important practical implications of the relationships shown in Figures 1-3. During processing, if the conversion reaches 90%, most would think, OK, I’m good, until they measure the Tg or the final mechanical properties and find out they are not what they require. When investigating a thermosetting polymer system, one of the first tasks should be to determine the ultimate glass transition temperature which is denoted at Tg∞.
A simple method to determine Tg∞ is to use differential scanning calorimetry (DSC). Place an uncured sample in a DSC pan and scan at 10ºC/min to a temperature above an estimate of Tg∞ . The first DSC scan will allow measurement of the total heat of reaction, ΔHrxn (or sometimes called ΔHtotal). During the first scan make sure the temperature is above the end of the exothermic peak to allow for full reaction. Then cool the sample to room temperature and then start a second scan at 10ºC/min to above the estimated Tg. The second scan will reveal the Tg. It is very important to have the temperature high enough during the first scan to fully cure the sample but not exceed a temperature where the network will thermally degrade. The next post will describe how to build the Tg-conversion plot using DSC.
One might wonder why Wisanrakkit and Gillham used TBA to measure the Tg. Professor Gillham is famous for his Time-Temperature-Transformation (TTT) diagram and used the TBA to get the data to build TTT diagrams. Interested readers can find the details in reference 4.
References
- Wisanrakkit, G. and Gillham, J. K., Journal of Applied. Polymer Science, 41, 2885 (1990).
- J. Flory, J. Am. Chem. Soc. 63, 3083 (1941).
- Flory, Principles of Polymer Chemistry, Cornell Univ. Press, Ithaca, NY (1953)
- Wisanrakkit, G. and Gillham, J. K., Journal of Applied. Polymer Science, 42, 2453 (1991).
Leave a Reply