Previously we described how to measure the viscosity profiles during non-isothermal curing typical for many prepreg and composite processing situations (lamination, autoclave, etc.). The chemistry is tailored to allow for the resin to soften and flow with the chemical reaction occurring at an elevated temperature. The elevated cure initiation is accomplished using a latent hardener/catalyst system. The objective is to allow the resin to soften and have good flow, then start the curing process. Remember the typical cure chemistry proceeds as follows:
- Chain extension and molecular weight build first. The multifunctional resins and hardeners have reactive groups on the ends, so during the first stages of conversion, chain extension builds the molecular weight
- Crosslinking proceeds next. Once the multifunctional reactive groups begin to build molecular weight, crosslinks start to build the network quickly leading to a very rapid rise in the molecular weight and hence the viscosity.
- Gelation occurs limiting macroscopic flow. Once the gel point is achieved, this is the end of the process window. Using small amplitude oscillatory measurements allows us to probe the curing reaction well beyond the gel point.
The question was; how do you correlate what’s going on during curing with the viscosity profile? The way we did this was to “abort” the rheometer run during a non-isothermal viscosity profile. We could accomplish this since the rheometer had disposable plates which could be quickly removed at various points along the viscosity profile.
The figure below shows our method. The blue is the sample between the disposable parallel plates (roughened aluminum). The non-isothermal rheology testing was started. At prescribed intervals, the rheometer oven was opened, the disposable plates with the resin were quickly removed, and the plates/resin were quenched in a liquid nitrogen bath next to the rheometer. The rapid quenching in the LN2 stopped the chemical reaction allowing us to measure the cure state using Differential Scanning Calorimetry (DSC).
For each sample, the DSC scan was run to measure the heat of reaction and the glass transition temperature. In the series of DSC curves on the right, the Tg steadily increases and the heat of reaction (delta H) steadily decreases as a function of cure time.
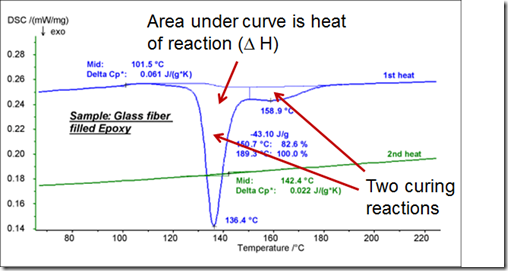
A typical DSC trace for a B-staged prepreg is shown in the next figure.
The DSC trace is information rich. The area under the curve provides the heat of reaction (delta H). Looking at the DSC curve, there appears to be two curing reactions, one centered at 136oC and a second higher temperature curing reaction around 160oC. To calculate the conversion, the total area under the cure at time zero is needed and then to calculate the conversion at various points along the curve, the delta H residual is measured.
In terms of a DSC measurement the conversion or degree of cure at time t, αt, is defined as:
![clip_image002[7]](https://polymerinnovationblog.com/wp-content/uploads/2014/04/clip_image0027_thumb.png)
where delta Hres is the residual heat of reaction at time t. Thus at each “aborted” rheometer run, the conversion may be obtained. Additionally, during the DSC run, the Tg can also be measured.
In the next post we will discuss how the Tg and conversion are related to the viscosity profiles during a non-isothermal cure profile.


Leave a Reply