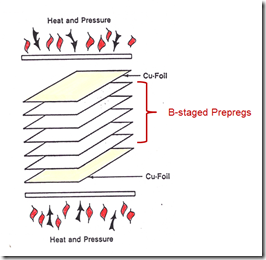
Our last post introduced non-isothermal rheology as a characterization technique to measure the viscosity during processing (typically non-isothermal temperature profiles are used). A good example of how rheological methods can be used to optimize a process is to consider a composite lamination process. In the figure on the left, B-staged prepregs are sandwiched between to sheets of copper foil to produce a copper clad laminate. During the lamination process, the temperature is increased using a controlled heating rate to the cure temperature. The press temperature is adjusted depending on the final Tg of the fully cured resin matrix. As we have discussed in a previous post (and it is worth repeating here) one must take care to set the final cure temperature to be at least equal or greater than the final Tg to ensure rapid cure kinetics and to achieve full cure.
In the following figure, the complex viscosity is plotted as a function of time for a series of heating rates. As was seen in the previous post, the viscosity drops as the resin is heated and then as the chemical reaction occurs (first chain extension then crosslinking), the viscosity increases quickly. In the data below, the heating rate encompasses a fairly limited range. One observes the viscosity minimum to increase slightly with slower heating rates. The data shows the typical U-shaped viscosity curves.
Now let’s look at the role of heating rate on the viscosity profiles. In the data below for a B-staged epoxy prepreg for copper clad laminates, the heating rate was varied over a wide range. Additionally, the viscosity curves were monitored over a large portion of the curing/lamination process allowing the estimation of the viscosity near the fully cured region. The reason the viscosity does not become infinite is that small amplitude oscillatory parallel plate measurement were used.
The heating rate has a pronounced effect on the the minimum viscosity. Notice that the viscosity curves asymptotically approach the same value indicating the same level of cure or network formation. In this case, the epoxy resin fully cured Tg was 130oC and the cure temperature (press temperature) was 175oC. This allowed for full cure in the rubbery regime. Vitrification during curing was eliminated since the press temperature was 45oC higher than the epoxy final Tg.
The manufacturing implication is that the engineers could dial in the heating rate to get the appropriate amount of flow (to wet the copper surfaces and consolidate the multiple plies) but not impact the degree of cure. Flow in the press is proportional to the area above the curve (logarithmic integral relationship, we will discuss in a future post), the minimum viscosity plays a key role in the flow during composite lamination.
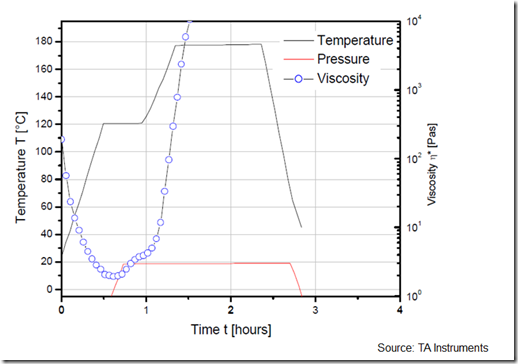
In many cases, a two step temperature profile is used. The first heating rate is used to soften the resin and achieve good wet-out of the fibers, ply consolidation, and good wetting/adhesion. In the figure below, one observes the viscosity decreases and achieves a minimum viscosity during the first heating ramp. The temperature hold time allows for good flow and wetting between the plies.
Additionally, the the first hold temperature is designed to get the resin flowing (temperature dependence of the viscosity) but not cure, at least at a fast curing rate. Also note that the pressure is applied during the first temperature hold to enhance flow and wetting.
The second ramp to a higher cure temperature is designed to “kick-off” the curing reaction. This can be seen by the rapid increase in the viscosity during the second ramp. Careful selection of B-stage conditions and curing agents (hardeners/catalyst packages) can be used to tailor the viscosity profiles during composite processing. Using dynamic mechanical analysis with small amplitude oscillatory rheometry will provide useful insights to to guide engineers during process development. Additionally, the chemists and material scientists developing the resin system now have additional tools to help in the resin, hardener, and catalyst selection during product development.
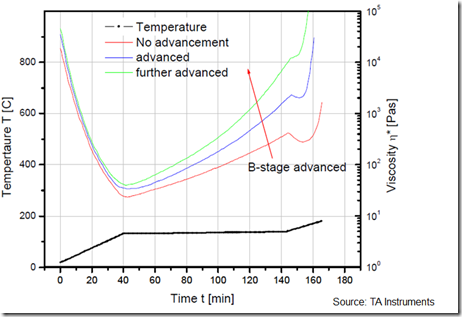
Another “lever” the process engineer has at his/her disposal is to control the degree of B-stage advancement. In the following figure, the viscosity profiles for prepregs with three levels of advancement are plotted as a function of time. Note all three curves were generated using the same temperature ramp, hold and second ramp. The degree of B-stage advancement controls the minimum viscosity. More advancement means the molecular weight is larger, i.e. molecular weight increases with advancement. Recall that the viscosity increases with increasing molecular weight, to the higher the B-stage advancement, the higher the minimum viscosity. As we say above, the first ramp and hold is designed to achieve good flow, fiber wet-out and ply consolidation. The degree of B-stage advancement is readily apparent in the second ramp. Note that due to the second heating rate, there is additional viscous softening resulting in a second viscosity minimum.
Dynamic mechanical rheological analysis with a non-isothermal temperature profile can provide significant insights into composite processing and can serve as a guideline in process development.


![image_thumb6[1] image_thumb6[1]](https://polymerinnovationblog.com/wp-content/uploads/2014/09/image_thumb61_thumb.png)


Leave a Reply