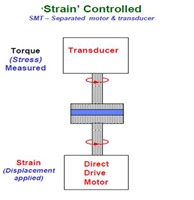
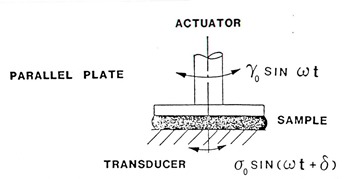
Thermoset rheological characterization is typically done using controlled strain experiments. We discussed this in the Dynamic Mechanical posts in the characterization series. For rheometry, we use a rotational shear geometry so we are reporting the dynamic loss modulus as G” and the dynamic storage modulus as G’. As discussed in the previous post, the most common geometry for thermosets are parallel plates. To measure the rheological properties, a sinusoidal oscillation is applied using the direct drive motor and the resulting stress is measured.
For small amplitude, time-independent polymers (i.e. linear viscoelastic regime) the resulting stress is given by:
The dynamic storage modulus, G’ and the dynamic loss modulus, G” can be calculated from tan delta (remember polymers are viscoelastic and there is a phase lag due to the viscous component).
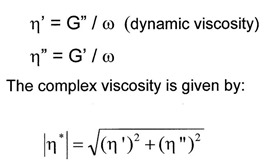
From the dynamic moduli, the viscosity can be calculated:
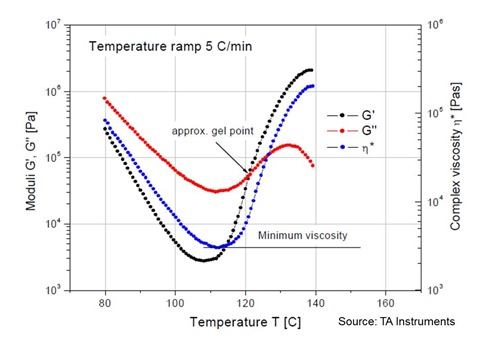
Enough of the equations, so how can we use the complex viscosity to gain insight into the curing process? In the following figure, the complex viscosity (blue curve) is shown along with the G’ (black curve) and G” (red curve) measured at a heating rate of 5oC/min for a B-staged (partially cured) thermoset.
 There are some interesting features to note. During the initial softening (since the material was B-staged, the resin goes thru the glass transition (Tg) about 80oC) the viscosity drops by several orders of magnitude. This is critical for example in a composite lamination or autoclave process where the resin needs to soften and flow to wet the adjacent plies. Remember the complex viscosity is composed of the two dynamic moduli. During the viscous softening, G” (viscous component) is the larger component controlling the viscosity. This makes sense since in the viscous state one would not expect much elastic properties (extended chains with little crosslinking). As the crosslinking proceeds, first through chain extension (remember the epoxy-amine curing chemistry discussed previously where we showed the initial chemical reactions lead to growing chains) and then followed by crosslinking. As the network builds, one observes a rapid increase in the storage moduli (elastic component) and the crosslinking leads to elastic networks. At around 120oC the elastic component becomes larger than the viscous component indicating the formation of a large elastic network. Since the curing is done where the Tcure > fully cured Tg, then the material is in the rubbery (elastic) phase throughout the rheological experiment.
In a future post we will discuss the significance of the point where G’ and G” crossover. This is an approximate measure of the gel point.


Leave a Reply