In previous posts we set the stage for understanding how the viscosity profile changes during non-isothermal curing. We showed how heating rate changes the minimum viscosity, how during the initial softening of a B-staged prepreg, the viscosity is dominated by the temperature dependence and when using latent hardeners, there is no chemical reacting during the initial viscosity drop. After the minimum viscosity, the rapid increase in viscosity is due to the chain extension and crosslinking of the reactive monomers and oligomers.
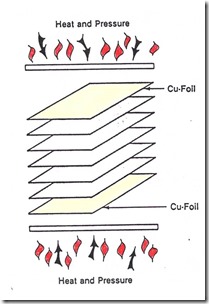
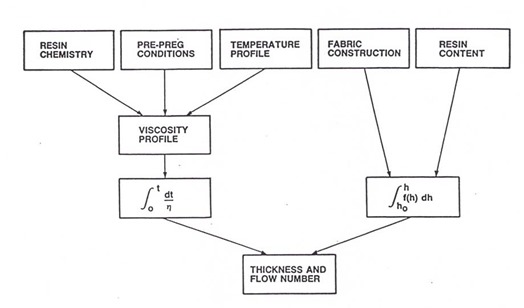
So now let’s take a look at how to put this all together. We will use the case of a composite lamination of multiple plies of B-staged prepreg that have a latent hardener (the cure kick off temperature is around 125oC). The laminate stack-up is placed between heated platens maintained at the desired cure temperature (in this case 175oC). The heating rate is controlled by thermal insulating materials (press pads with controlled thickness and thermal conductivity). The lamination process can be represented by the following block diagram:
One observes that there are two key relationships; one is the viscosity integral and the second is the thickness integral. The viscosity integral is controlled by the resin chemistry, prepreg conditions (i.e. degree of cure at the B-stage) and the lamination press temperature profile. The prepregs being laminated consisted of a woven glass fabric impregnated with an epoxy resin. The two thickness parameters are the thickness of the glass cloth plies and the resin content. The thickness is chosen to give a specific thickness/ply and the resin content can be varied during the impregnation process.
A parameter called the flow number is used to characterize how much resin flows out of the stack during the lamination process. The relationship for the flow number is:
The major variables to consider are the lamination press force, F, the initial stack thickness, h, the “effective radius”, R, the resin and glass densities, and the viscosity integral. Note the viscosity integral goes from time zero to tgel. Remember that at the gel point macroscopic flow ceases, the we only need to integrate the viscosity up to the gel point. Also note that the viscosity integral is the area above the viscosity curve and is a linear relationship. Most of the viscosity graphs we have shown are log plots, so the effect of the viscosity integral is very large on the overall flow.
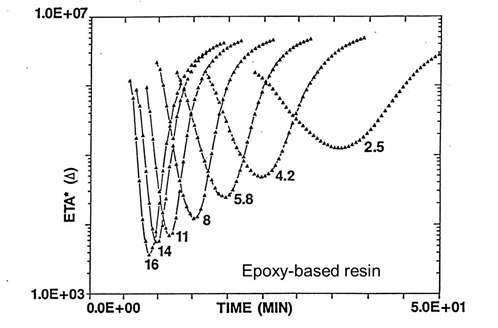
In a previous post we demonstrated how changing the heating rate had a dramatic impact on the minimum viscosity and the width of the flow window. This can be seen in the following figure:
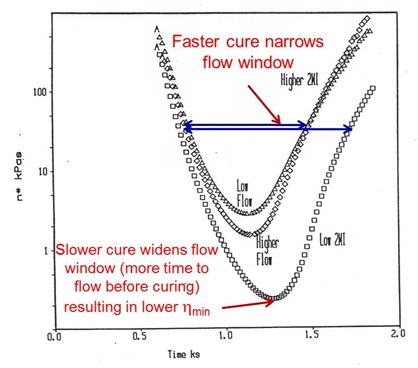
The process engineer has a way to control the area above the curve (the viscosity integral in the equation above) by optimizing the heating rate to give the desired flow and ply consolidation. Remember the cure is driven by the final lamination temperature, so as long as the final Tg is near or below the Tcure, then the chemistry will be driven to full cure. There is another way to control the viscosity integral using cure chemistry. By changing the amount of hardener/catalyst, the flow window can be controlled. In the following figure, the flow window was controlled in two ways:
- Changing the amount of 2-methyl imidazole (2MI) which is a very common latent curing agent/catalyst for epoxy resins.
- Changing the degree of B-stage advancement.
Let’s look at how the 2MI concentration changes the viscosity profile. It is important to note that all three curves above were obtained at the same heating rate. In the above two curves, the amount of 2MI was held constant. In the lower viscosity curve, the amount of 2MI was lower. The net result is that at lower 2MI concentrations, the temperature dependence of the viscosity controls the viscosity for a much longer time resulting in a much lower minimum viscosity. The cure reaction kicks off at a longer time resulting in a wider flow window.
In the upper two viscosity curves, the amount of 2MI was held constant, but the degree of B-staging was changed, The upper curve (lower flow) had a higher degree of B-stage advancement compared to the middle curve (less B-stage advancement resulting in a lower minimum visocisty). Note that the width of the flow window is constant for the upper two curves, since the 2MI concentration is the same.
Let’s examine our viscosity integral relationship to pull all of the concepts together. We can clearly see the viscosity minimum is the key variable in governing the flow (when the other press parameters are held constant). When designing a lamination process, the process engineer and the chemist can work hand-in-hand to dial in the right flow. The press process can be used to tailor the heating rate and the cure chemistry (hardener/catalyst concentration) can be used to tailor the width of the flow window. This is the origin of the term chemorheology of thermoset cure. Both the chemistry and the rheological properties play a key role in the lamination process.


Leave a Reply