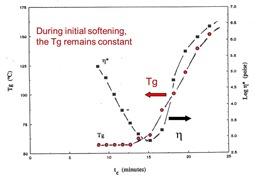
In our last post we showed how the chemical conversion and glass transition temperature (Tg) were correlated to the viscosity during a non-isothermal curing profile. We will continue our analysis of the aborted rheometer data in this post.
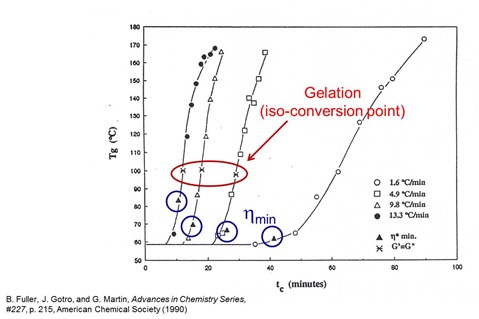
In the data presented in Part 8, the heating rate was held constant. In reality, we did experiments at several heating rates and the data was similar in terms of how the Tg and conversion remained constant during the initial viscosity decrease and then rapidly increased as the chemical curing reactions proceeded. Another way to look at the data is to plot the Tg as a function of curing time for several heating rates. In the following figure, the Tg/time data is presented at four heating rates to a cure temperature of 175oC.
If you remember from a previous post, one can estimate the gel point from the G’ and G” crossover during the non-isothermal cure profile. For three of the heating rates, the G’/G” crossover point was noted on the graph. As would be expected, the gelation point occurred at the same Tg (within experimental error) for three heating rates. The gel point is an iso-conversional point meaning that gelation occurs at the same degree of conversion and is controlled by the chemistry (actually the functionality of the reactants). For a given resin/hardener combination, the gel point will occur at the same conversion.
The point where the minimum viscosity occurred was also noted on the plot above. At the fastest heating rate, the Tg at the minimum viscosity is higher than at the slower heating rates. This is a manifestation of the two competing physical phenomenon during non-isothermal curing:
- Viscosity decrease due to increasing temperature
- Viscosity increasing (and Tg increasing) due to chain extension and crosslinking
At the faster heating rates, the Tg is increasing faster and thus the Tg is higher at the minimum viscosity point.
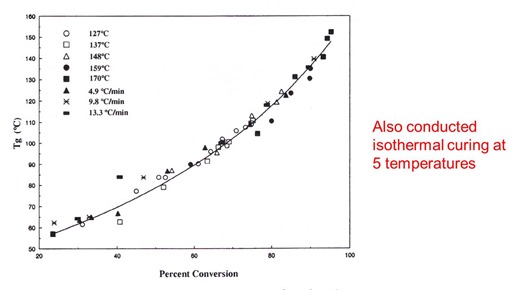
The Tg is a very good indicator of the degree of cure in crosslinking systems. In addition to the non-isothermal runs, we also did isothermal curing at various temperatures. Similarly, we aborted the isothermal cure and ran DSC to obtain Tg and conversion. In the following plot the Tg-conversion relationship is shown for all data, both from isothermal and non-isothermal curing.
The data all fall on a single curve. The significance of this is that the curing is “cure path independent” meaning the Tg – conversion relationship will be the same for either isothermal and non-isothermal curing. This is important in processing thermosets, since we saw earlier that changing the heating rate can be used to “dial in” the flow, since the heating rate doesn’t change the cure pathway, then we can be assured that the final Tg will be the same as long as we keep the cure temperature the same.
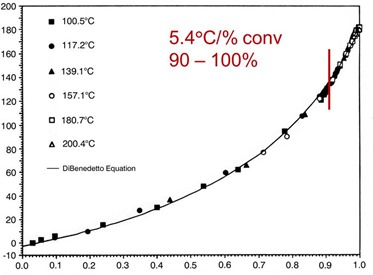
Extensive work by Professor John Gillham and his students has demonstrated that this type of Tg/conversion relationship occurs in thermosetting polymers. In the following figure from their work, one observes the same type of Tg/conversion relationship.
From Venditti and Gillham, J. Appl. Polym. Sci., 64, 3 (1977).
They also found the Tg/conversion data can be represented by the DiBenedetto equation:
For more details, the reader is referred to the Gilham reference above.
The practical significance of our data and the literature is that the Tg increases significantly in the final stages of curing. The Tg increases at a rate of 5.4oC/% conversion in the range of 90-100%. It is not uncommon for the Tg to increase on the order of 30-40oC as the network “locks down” as the last crosslinks are being formed.


Leave a Reply