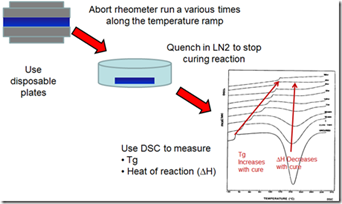
In our last post we provided the background on how to correlate the viscosity, conversion, and Tg during non-isothermal curing. We used the technique in the figure to the left to “freeze the action” along the viscosity profile and use DSC to probe how the curing was progressing.
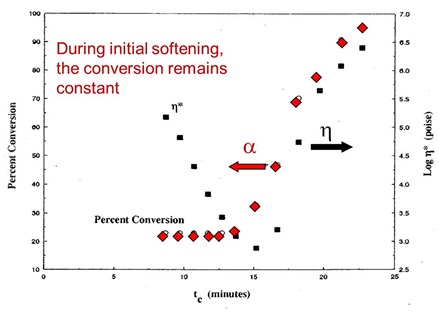
In the next figure, the percent conversion is plotted as a function of time on the left axis and the viscosity is shown on the right axis. Remember, the percent conversion is how many reactive groups have been consumed during curing. So in the plot below, the material was B-staged, so one observes the conversion to be approximately 23% (i.e. 23% of the total reactive groups have already reacted).
In the figure above, each pair of data points represents a rheometer run that was allowed to proceed for successively longer times. Remember, at each viscosity data point (black squares) after the viscosity was measured, the run was aborted, the sample quenched, and subsequently run in the DSC to measure conversion and Tg. It is obvious that the chemical curing reaction is not taking place during the initial viscosity decrease since the conversion remains constant. The chemical reaction is controlled by the use of a latent catalyst that allows the resin to soften and flow in the press before the curing reaction starts. The conversion starts to rapidly increase prior to the minimum viscosity since there are two competing physical phenomenon occurring:
- Viscosity decrease due to the temperature increasing
- Viscosity increasing due to the curing reaction
When the molecular weight increase (i.e. viscosity increase) due to the chemical reaction dominates, the viscosity goes through a minimum and then rapidly increases.
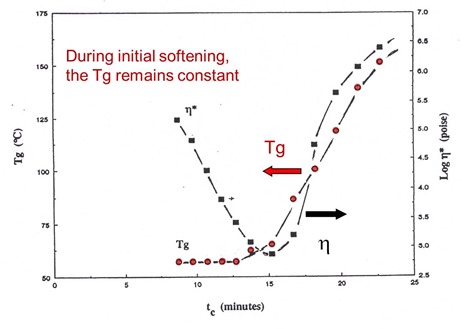
In the following figure, the viscosity and glass transition temperature (Tg) are plotted as a function of time for the same set of aborted rheometer runs.
As was observed with the conversion data, the Tg remains constant during the viscosity decrease, then rapidly increases due to the curing chemistry.
As we saw in the previous posts, the heating rate can be used to tailor the viscosity window, with faster heating rates to the cure temperature causing a narrower flow window and lower minimum viscosity, while slower heating rates result in a wider flow window with a higher minimum viscosity. Selecting the appropriate latent hardener/catalyst system then allows the resin to soften and flow prior to rapid crosslinking. By understanding the roles of curing chemistry and the physics of the effect of heating rate, the process can be optimized to achieve both good flow and full cure.


Leave a Reply