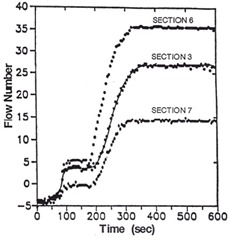
 The prepreg resin content and degree of B-stage advancement (percent conversion) were shown to have an impact on the flow during lamination. As presented in the previous post, the figure on the left shows the flow number for several specially prepared prepregs.
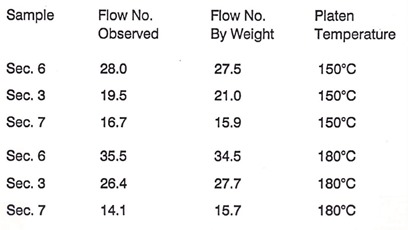
To validate that the flow number obtained using the squeezing flow was close to the flow number measured using the standard IPC flow test, the flow number was measured using the initial and final weights and compared with the flow number obtained in the squeezing flow test. The comparisons were done at two lamination temperatures to test the utility of the squeezing flow test in the typical temperature ranges using in lamination. The table below shows the comparisons.
The flow number observed was determined from squeezing flow. The agreement is very close at both lamination temperatures demonstrating that the squeezing flow test can be an effective tool for developing new lamination processes.
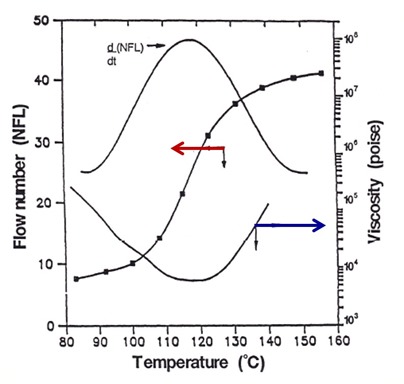
With that said, how are the flow number and the and the viscosity related? In the following figure, the flow number (NFL) and viscosity are plotted as a function of temperature.
The flow number versus temperature data was smoothed and then the derivative was obtained using the smoothed curve. As one can see, by taking the derivative of the flow number with respect to time (d(NFL)/dt), the maximum in the derivative signal closely corresponds to the minimum in the viscosity. From this relationship, we see that the steeper the slope of the flow number versus time relationship, the lower the viscosity and the viscosity window will be narrower.
To demonstrate how the viscosity flow window impacts the flow number, a different resin system (high Tg epoxy prepreg) was examined using oscillatory parallel plate rheometry and subsequently the flow number was measured using the squeezing flow test. The temperature ramps were 15, 10, 5, and 2.5 C/min to the cure temperature of 175C. In the following figure, the complex viscosity is plotted as a function of time.
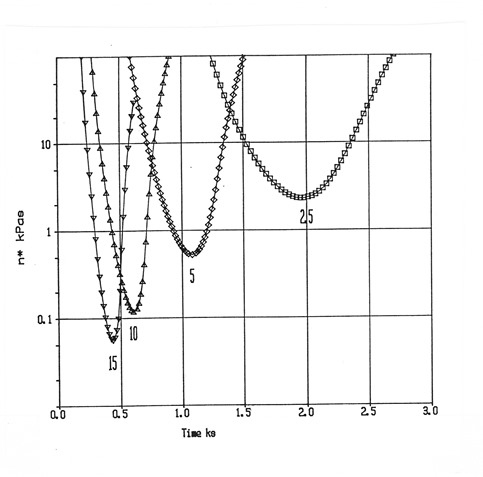 The viscosity profiles exhibit the classic flow window shape; faster heating rates result in lower minimum viscosities and narrower flow windows. At progressively slower heating rates, the viscosity minimum increases and the flow window widens. The squeezing flow test was used to determine the flow number versus temperature using the prepregs used in the oscillatory rheometry measurements above. In the following figure, the flow number is plotted as a function of temperature for the prepregs at the same heating rate as the viscosity profiles.
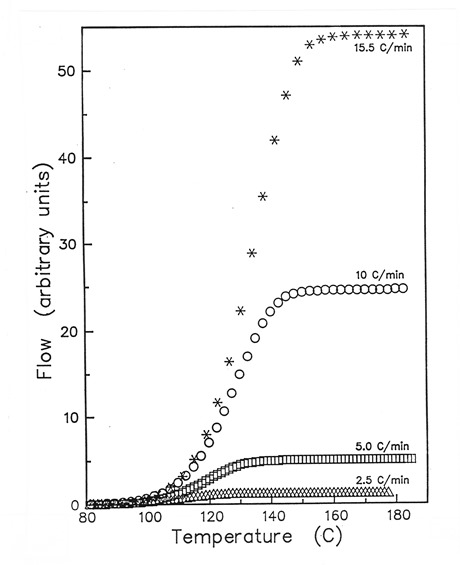 The flow number plots clearly show the large impact of the minimum viscosity on the level of flow during lamination. At the fastest heating rate, there is a very large amount of flow compared with almost no flow at the slower heating rates. For this analysis, the resin content and percent conversion were held constant and only the heating rate was varied during the squeezing flow test.
With this type of insights, the process engineer can then tailor the heating rate to achieve a given amount of flow. As we saw before, depending on the final thickness required, the resin content, percent conversion (B-stage advancement) and the heating rate can be tailored to achieve the final laminate thickness. For high performance electrical laminates, obtaining a low dielectric constant is required to increase the signal propagation speed. Glass fabric has a high dielectric constant, so maximizing the resin content for a given laminate geometry will result in faster signal propagation. Using the concepts presented in this case study, the process engineer can reliably manufacture complex laminates with optimum electrical properties.
In the next post we will demonstrate how changing the curing chemistry impacts the flow number and viscosity integral.

Leave a Reply