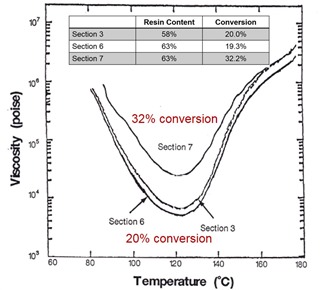
 This post will focus on examining the lamination performance of the three types of prepregs described in the previous post. Three prepreg samples were made using a production treater tower. The table in the figure on the left summarizes the resin content and degree of B-stage advancement (percent conversion). The figure also demonstrates how the B-stage advancement controls the minimum viscosity for a given heating rate to the final cure temperature.
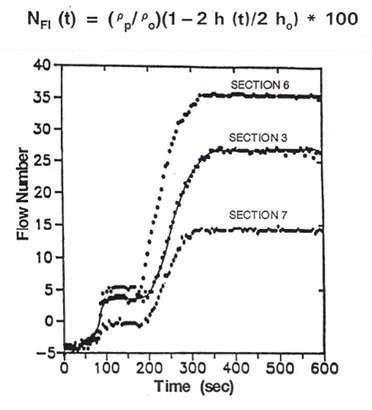
The squeezing flow apparatus was used to investigate the flow number versus time for non-isothermal lamination profiles. The copper platens were heated to 180C. The sample layup for each of the three prepreg sections was placed between the copper platens, a constant force of 89 Newtons was applied and the change in sample thickness with time was recorded. In the following figure, the flow number is plotted as a function of time:
 The flow appears to occur in two steps, with the first step resulting from the consolidation of the prepregs (a stack of four prepregs were used in the squeezing flow test). This is due to the uneven topology from the woven glass cloth in the prepregs. Once the prepregs “nested” the flow number was a good indicator of the prepreg flow. There are a few features to note.
- We ran the flow test for the standard 10 minutes used in the IPC-TM-650 flow test.
- After the initial consolidation, there is a large step jump in the flow number indicating resin flow as a result of the dramatic decrease in the resin viscosity
- At approximately 300 seconds, the flow levels out quickly and attains a plateau in the flow number
- The final flow number is distinctly different for each prepreg section.
Considering the geometry of a single sheet of prepreg, one would not expect the woven glass fabric to flow. Only the resin will flow, but some of the resin is trapped in the “windows” of the woven glass cloth (prepreg with low dielectric constant has open weave to allow higher resin contents). Essentially only the resin above and below the woven glass cloth will flow.
Now let’s look at what controls the flow number. When the temperature increases, the viscosity decreases after the prepreg Tg. With decreasing viscosity, the flow number will increase as the resin flows out of the layup under the applied force. The resin will continue to flow until the gel point at which time the macroscopic flow will cease. This is clearly visible in the flow number vs time plot above. It is very clear when gelation occurs since the flow number is constant past the gel point. The softening at Tg, decrease in viscosity, subsequent chain extension leading to increased viscosity and finally gelation define the flow window.
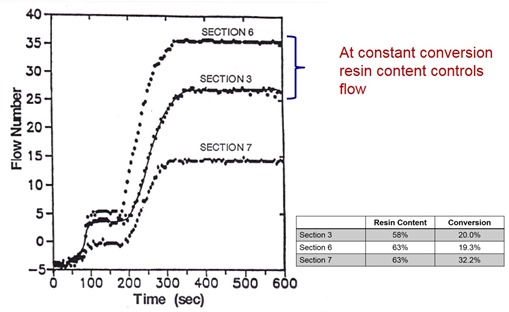
Now let’s look at what controls the magnitude of the flow number. In the following figure we examine the flow number as a function of time at constant conversion:
 Examining the table above, section 6 and 3 have essentially the same degree of B-stage advancement (percent conversion). In this case, the resin content controls the amount of flow. Recall above where the “flowable” resin is actually above and below the plane of the glass cloth, and thus during squeezing flow (i.e. lamination) having more resin above and below the glass cloth will result in higher flow (larger change in the thickness vs time).
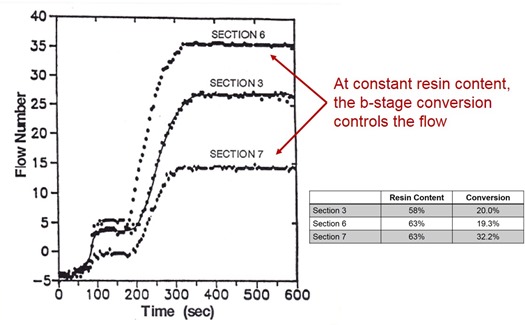
Now let’s look at the case where we keep the resin content constant, but vary the amount of B-stage advancement. Section 6 and 7 have the same resin content, but section 7 had a higher degree of conversion (more chemical reaction leading to higher molecular weight).
 In this case, one observes the rather large impact of the conversion on the flow. Both section 6 and 7 had a fairly large resin content (that could lead to a high amount of resin flow). The percent conversion for section 7 was about 60% higher than section 6. The impact on the flow is dramatic. When the available flowable resin is the same, the actual flow is governed by the viscosity, i.e. the degree of advancement. The higher the minimum viscosity, the lower the flow. Prepregs with low B-stage advancement (percent conversion) will flow more due to the lower viscosity minimum.
We have demonstrated how the flow during lamination can be carefully controlled by:
- Determining the proper resin content to achieve the desired ply thickness
- Controlling the B-stage advancement to obtain the desired flow and thus resin thickness.
In the next post, the relationship between the flow test and viscosity profile will be examined.


Leave a Reply