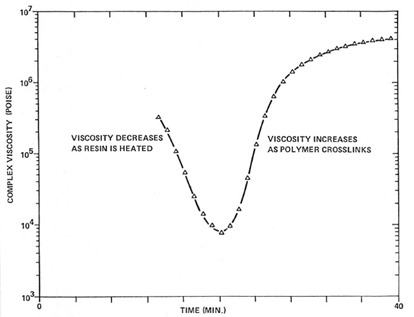
 In this post we will briefly review the viscosity changes during the non-isothermal heating of B-staged epoxy prepregs and describe a set of carefully controlled prepreg samples used to demonstrate the utility of the squeezing flow test. Recall that during non-isothermal processing, at the B-staged prepreg glass transition temperature (Tg), the resin viscosity decreases dramatically and then as the chemical crosslinking reactions lead to an increase in molecular weight, the viscosity then rapidly increases yielding what is called the viscosity flow window (or as described in the previous posts as the viscosity integral). The typical U-shaped viscosity time profile at a given heating rate is shown in the following figure:
The objective of one part of our research was to investigate the role of resin content and B-stage advancement on the flow properties during lamination. During prepreg manufacturing, the resin content was measured by taking a sample from the moving web, use a die punch to cut a stack of 4 inch X 4 inch prepregs (also used for the flow test), weighing the stack, and knowing the weight of the glass cloth the resin content could be calculated.
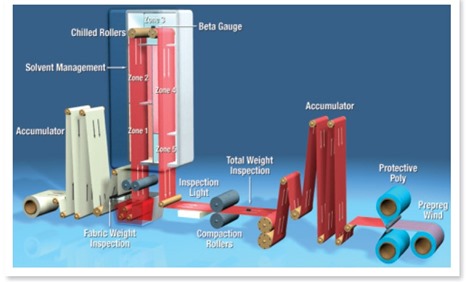
A typical prepreg treater tower is shown in the next figure (source Hexcel):
By controlling the nip rollers, the amount of resin applied to the moving glass cloth could be precisely controlled. In the first two zones in the treater, the solvent is evaporated. In the fourth and fifth zone, heat is adjusted (or at constant zone temperatures the web speed is changed) to control the amount of B-stage advancement (chemical conversion of epoxy groups). A production treater was used to make the following three prepreg samples:
To measure the percent conversion, the unreacted resin was measured using Differential Scanning Calorimetry (DSC) to establish delta H at time zero. A sample of each section was then run in the DSC to measure the residual heat of reaction. The fractional conversion for each section was calculated using:
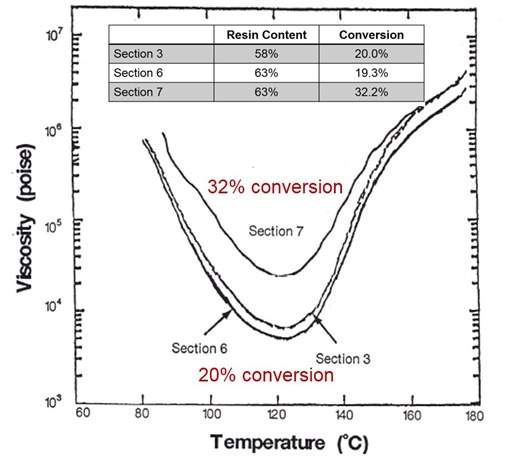
The percent conversion is simply the fractional conversion multiplied by 100. Section 3 and 6 were made to have essentially the same degree of B-stage advancement (percent conversion is approximately 20%) but with lower and higher resin contents. For sections 6 and 7, the resin content was held constant and the degree of cure was varied. Section 7 had high resin content and the most advancement (in this case, 32.2% of the reactive groups were converted).
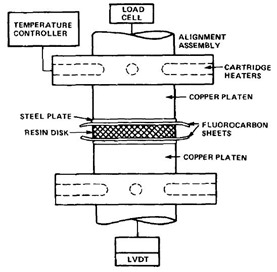
The viscosity profile for each of these sections was measured using the squeezing flow geometry in the Instron test frame (1). Using the Stefan equation and measuring the rate of plate closure (-dh/dt) the viscosity was calculated.
The heating rate was controlled by placing insulating material between the copper platens and the sample layup. The B-staged resin was removed from the glass cloth, sieved to remove stray broken glass fibers and molded into a void free 50 mm disk without advancing the resin. In the following figure, the viscosity for the three sections is plotted as a function of temperature for a fixed heating rate:
The main feature to note is that the minimum viscosity is controlled by the amount of chemical reactions (percent conversion) that have increased the growing network chain lengths. At higher conversions, that is higher molecular weight, the minimum viscosity is almost an order of magnitude higher.
In the next post the relationship between the flow number and the viscosity profile will be explored.
References
1) Tungare, Martin, and Gotro, Polym.Eng. and Sci., 28, no. 16, 1071, (1988)


Leave a Reply