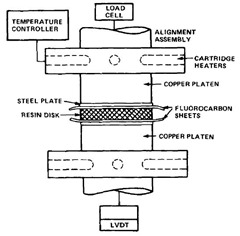
In the last post we introduced the concept of the squeezing flow test and how the viscosity is related to the rate of platen closure using the Stefan equation. We also described a custom fixture (shown at left) developed at Syracuse University jointly with IBM to investigate the rheological properties during squeezing flow testing.
In the next few posts we will be showing how the flow test can be used to gain insight into the rheology during composite lamination. Bear with me for a little bit as I dive into some of the background theory.
Since the geometry above is circular (as compared with the square samples used for the IPC flow test), we used a slightly different way to calculate the percent resin flow (equation 1):
In this case, we assume the flow is uniform across the laminate and just use the weight of the initial and final samples. The disk radius was 25.4 mm (2 inch diameter). The weight was recorded for the original stack (4-8 plies) and then the squeezing flow test was run. Assuming only the resin flows during the test, the final 2 inch diameter disk was trimmed to the original 2 inch diameter circular disk (i.e. removing the resin that flowed outside of the original area). The weight of the laminated sample was measured after trimming and the flow number was calculated and recorded.
To relate the material properties to the flow number, the equation above was re-cast into the following form (equation 2):
To relate the viscosity changes during squeezing flow, recall the integrated form of the Stefan equation is given by (equation 3, see June 1, 2015 post for details:
So we now need to rearrange the above equation using a little algebra to obtain h/ho and substitute into equation 2. The resulting expression is (equation 4):
From equation 4, one has a relationship between the viscosity (viscosity integral) and the physical sample geometries such as initial stack thickness, lamination force and the sample radius.
In the squeezing flow test using the Instron test frame, the rate of plate closure (-dh/dt) was measured continuously (1). For this case, the flow number may be cast as:

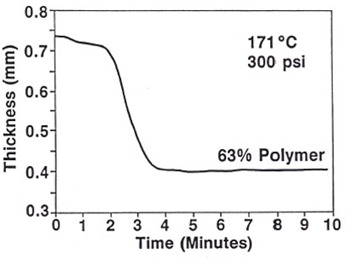
The Instron test geometry was then used to monitor the sample thickness as a function of time. A typical thickness vs. time plot is shown in the following figure:
As the B-staged resin softens, there is some initial “ply consolidation” as the knuckles of the glass cloth compact and nest with each other. This is observed as the small plateau up to about 2 minutes. When the B-staged prepreg softens at the Tg, we see a rapid change in thickness (slope is –dh/dt). The thickness changes until the resin reaches the gel point and flow ceases.
We now have the basics to look at how the resin viscosity impacts the flow number. The next several posts will describe how the above methods combined with oscillatory rheometry were used to investigate the role of resin content, prepreg advancement (degree of B-stage) and catalyst concentration on the flow properties during squeezing flow.
1) Tungare, Martin, and Gotro, Polym.Eng. and Sci., 28, no. 16, 1071, (1988)


Leave a Reply