 In the last post we started our discussion of how to monitor thermoset curing during processing and showed that the glass transition temperature (Tg) is a potential physical property that is useful for cure monitoring. A common and easy way to measure Tg is using differential scanning calorimetry (DSC), but there are other analytical methods to determine Tg. First, let’s look at the Tg-conversion relationship to show how Tg measurements during curing/processing can be a powerful way to measure the extend of cure.
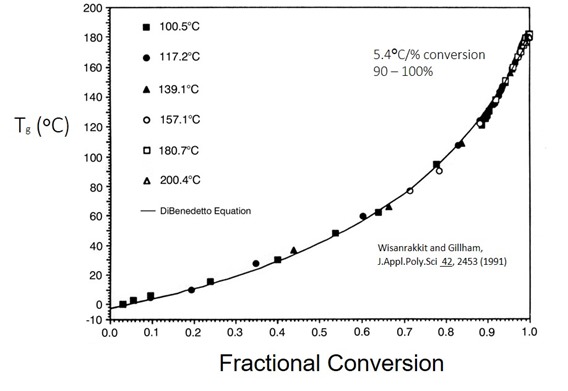
In Figure 1, Tg is plotted as a function of fractional conversion for an epoxy amine system at various isothermal temperatures (1). This is data from the same paper that we discussed in the previous post. In this work, the authors measured the Tg and the fractional conversion from careful DSC measurements.
Figure 1. Glass Transition Temperature (Tg) as a function of fractional conversion for isothermal curing of an epoxy amine system.
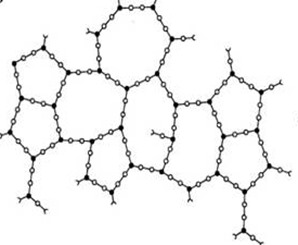
The shape of the curve in Figure 1 is interesting. Recall that during the early stages of epoxy amine curing the primary reaction pathway is chain extension as the multifunctional amines open epoxy groups. As the conversion increases, additional epoxy-amine reactions lead to crosslinking and building of the network. At lower fractional conversions, the Tg increases slowly. At a fractional conversion around 0.6 (60% conversion) the Tg-conversion curve begins to increase dramatically as the network tightens. In the fractional conversion range of 0.9 – 1.0 one observed a very sharp increase in Tg. It should be noted from a practical point of view, it is very difficult to measure 100% conversion. In any thermoset system there is likely some unreacted groups even at very high level of cure (from steric considerations). In this range the Tg increases by 5.4oC/percent conversion. In other words, the Tg increases by approximately 54oC when the conversion goes from 90% towards 100%.
A practical way to monitor the degree of cure for a thermoset system is to perform a series of isothermal cures at temperatures above what the estimated final Tg should be (from the technical data sheet or expected Tg based on the chemistry type) and then run DSC experiments to determine the Tg. When the same Tg is obtained for several temperatures above the estimated final Tg, one can reasonably infer what the ultimate Tg is. Remember, the ultimate Tg should be independent of curing temperature as long as temperature is at or above the final Tg to avoid vitrification.
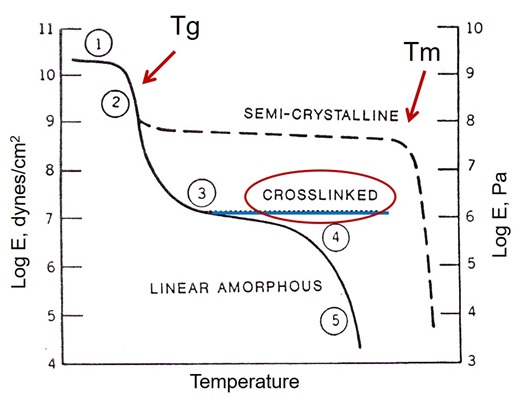
Now that we have established that Tg is a viable method to monitor the curing of thermosets, what exactly is the glass transition temperature? In Figure 2, a schematic of the modulus versus temperature is given for semi-crystalline, crosslinked, and linear amorphous polymers.
Figure 2. Schematic of the Modulus – Temperature relationship for various types of polymers.
Note that for all polymer types a Tg is present. In semi-crystalline polymers the Tg is sometimes hard to measure due to the high crystallinity (remember the Tg is only due to the amorphous component). Additionally, the defining transition for semi-crystalline polymers is the melting point Tm. In the case of linear amorphous polymers such as polystyrene, there is only a glass transition since in amorphous polymers there is not a crystalline region. Crosslinked polymers also exhibit only a Tg followed by the rubbery modulus (red circled region). In Figure 2, region 1 is the glassy modulus and regions 2 & 3 are associated with the glass transition region. It should also be noted that the glass transition occurs over a range and that the glass transition temperature (i.e Tg = 150oC) is defined by both the measurement method and the convention to assign the glass transition temperature (i.e. DSC midpoint).
Qualitatively, the glass transition temperature is defined as the onset of long-range coordinated molecular motion.
- Below Tg, 1-4 backbone atoms are involved
- High modulus
- Glassy behavior
- Above Tg, 10-50 atoms (actual chain segments) move in a coordinated manner :
- Rubbery plateau (crosslinked)
- Flow in thermoplastics (i.e. polystyrene)
From an experimental perspective, how do you measure the Tg? There are several methods but the most common are:
- Differential Scanning Calorimetry (DSC); measures the heat flow as a function of temperature (we have covered this already)
- Thermal Mechanical Analysis (TMA); measures the linear expansion as a function of temperature
- Dynamic Mechanical Analysis (DMA); measures the modulus as a function of temperature (like in Figure 2 above).
In the next post we will discuss both TMA and DMA and then compare all three of the above methods.
References:
1) Wisanrakkit and Gilham, J. Appl. Poly. Sci., 42, 2453 (1991)


Leave a Reply