Guest Post by Dr. R. Bruce Prime
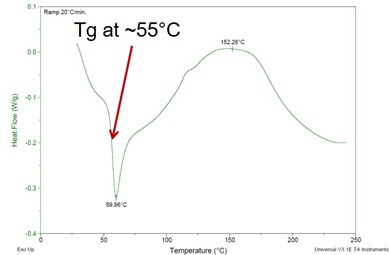
 As we have described before, differential scanning calorimetry or DSC is the most widely used analytical technique to characterize thermoset cure, due its ability to quickly and accurately measure the glass transition temperature Tg and conversion or degree of cure. Tg is the temperature where on heating the thermoset changes from a rigid glass to a liquid, or to a rubber if it has gelled. In previous recent posts we have observed an enthalpy relaxation peak immediately after the glass transition (peak in the image at left just after the Tg). In some cases the two events overlap and it can be challenging to get a good measure of Tg. In these cases modulated temperature DSC (MTDSC) would separate the enthalpy relaxation and glass transition events, giving a clear measure of Tg. In this post we explain the nature of enthalpy relaxation and its importance, i.e. how much attention we should pay to it.
The presence of enthalpy relaxation is an indication that physical aging has occurred. Physical aging is a very important phenomenon that occurs in an amorphous polymer held below its Tg and it can cause polymers to fail. It is a relaxation process that takes place below Tg, and the magnitude of the enthalpy relaxation peak is a measure of the extent of aging. It is a densification process (volume decreases), and it often leads to embrittlement. Dimensional change and/or the development of stresses can also occur.
Molecular motion is fast in the liquid or rubbery states, i.e. above Tg, where the polymer can be considered to be at equilibrium. As the polymer vitrifies the equilibrium liquid or rubber becomes a glass with greatly reduced mobility and at temperatures below Tg will not remain at equilibrium. Mobility will continue to decrease as the temperature decreases. However, at temperatures up to about 50°C below Tg mobility is sufficient that the polymer glass will slowly relax in the direction of equilibrium. This slow relaxation is known as physical aging.
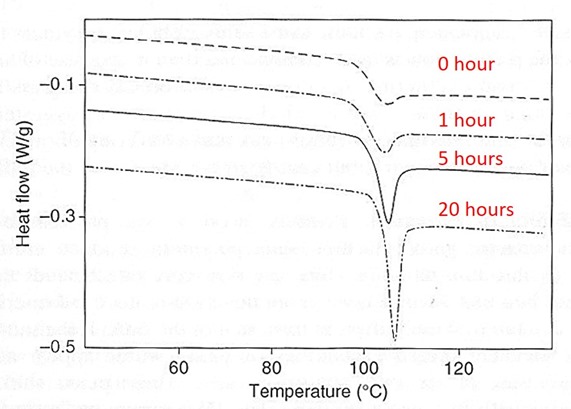
Figure 1. DSC curves showing the development and growth of an enthalpy relaxation peak immediately following the glass transition of polystyrene, after aging below Tg ~100°C. Annealing times at 80°C from top to bottom: 0 hr, 1 hr, 5 hr, 20 hr. From Ref. 1.
Figure 1 above shows the development and growth of an enthalpy relaxation peak in polystyrene as it is aged below its Tg. On cooling through Tg and immediately reheating (0 hr) a very small enthalpy relaxation peak is observed, due to fast relaxations immediately below Tg. As the sample is aged for various times at 20°C below its Tg the enthalpy relaxation peak can be seen to grow, giving a measure of the extent of physical aging.
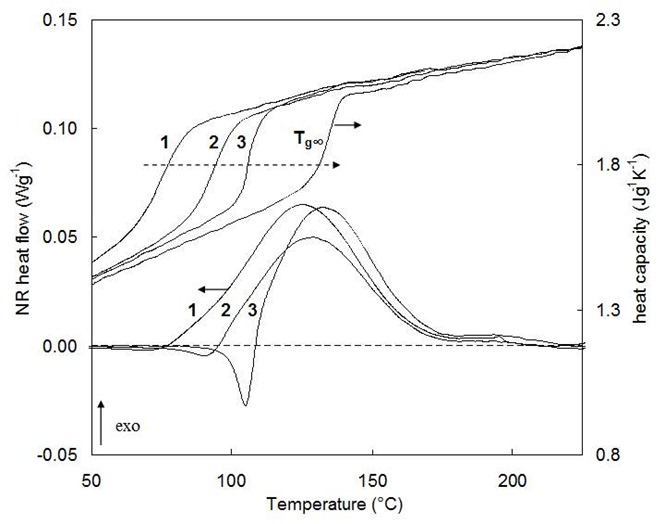
Figure 2. Isothermal cure of an epoxy-amine at 85°C: 1 after 165 min, 2 after 230 min, 3 after 800 min, and after full cure (Tg,¥). From Van Mele, Rahier, Van Assche, and Swier, Chapter 2 in Modulated-Temperature Differential Scanning Calorimetry: Theoretical and Practical Applications in Polymer Characterisation, Hot Topics in Thermal Analysis and Calorimetry Series (M. Reading and D. J. Hourston, eds.), Springer, Vol. 6 (2006).
Figure 2 illustrates vitrification and subsequent physical aging in a curing thermoset. Curve 1 shows Tg and residual cure for a sample whose Tg is still below the cure temperature of 85°C (not vitrified, therefore no physical aging). In curve 2 Tg has risen to ~85°C and the residual cure exotherm in the non-reversing heat flow is immediately followed by a small endothermic enthalpy relaxation peak. In curve 3 Tg has risen to well above the 85°C cure temperature and a significant enthalpy relaxation peak is observed.
For unknown samples the presence and size of an enthalpy relaxation peak will shed light on the thermal history of a material. In addition any stored stress will be released as a sample is heated through Tg and may also be detected on a DSC trace.
How do you measure Tg when you have an enthalpy relaxation peak? As mentioned above, if you have a modulated temperature DSC, the Tg signal is very clear in the reversing heat flow signal. In Figure 2, examining the upper curve, which is the reversing heat flow, the Tg is not affected by the enthalpy relaxation. Notice for the curves noted as 3, there is a large enthalpy peak in the non-reversing heat flow (lower curve) just above 100°C followed by an exotherm from additional curing. The reversing heat flow (upper curve) for curve 3 shows a distinct and clean Tg.
If you don’t have a MTDSC, then you can use a standard DSC to “erase” the enthalpy peak. Matsuoka and Bair (4) and Hale et.al. (5) describe a method where the sample was heated to the maximum of the relaxation peak to relax the effect of physical aging, quenching the sample, and re-running to obtain the glass transition temperature without the interference of physical aging. Care should be taken for thermosets to carefully stop the temperature ramp at the enthalpy peak maximum to avoid further curing. The second scan should yield a clean endothermic glass transition where the mid-point is easily determined.
References
1. Thermal Analysis of Polymers: Fundamentals and Applications, (JD Menczel and RB Prime, eds), Wiley, 2009, pp. 73-76.
2. M. R. Tant and G. L. Wilkes, Polym. Eng. Sci. 21, 874 (1981).
3. L. C. E. Struik, Physical Aging in Amorphous Polymers and Other Materials, Elsevier, 1978.
4. S. Matsuoka and H. Bair, J. Appl.Phys. 48, 4058-4062 (1977)
5. A. Hale, C. W. Macosko, and H. Bair, Macromolecules, 24, 2610-2621 (1991)


For R. Bruce Prime:
In this discussion of enthalpic relaxation, you state that a polymer not cured above its Tg-inf displays physical aging as a result of vitrification. It appears that the closer to Tg-inf it was cured, the more it displays aging (stronger relaxation peaks). Does this imply increasing embrittlement and potential failure (fractures)? Also, may I ask, what does this aging “densification” look like? Is it non-uniform “crowding” which produces defects and that produces fractures? I assume it is not a uniform shrinkage that would be more like a crystalline alignment. I have cured epoxy-amine polymers well above Tg-inf that still display several microns of enthalpic relaxation as measured by MTMA. Is that too small compared to what you have seen with below-Tg-inf curing and therefore not a signficant reliability risk?