The last post described some of the potential pitfalls of the controlled stress measurements. Controlled stress measurements are good if you require a precise yield point measurement. An example would be if you were designing the yield point for a particular dispensing application. The point-to-point creep test would allow the yield point to be measured accurately. If on the other hand, you wanted to measure the lot-to-lot variability or just needed the viscosity in the dispensing region (higher shear-stress or shear-rate) then using a method called a shear-rate sweep would work well. In this experiment, after the sample is carefully loaded into either the parallel plate or cone-and-plate geometry, the spindle rotation is started and applies a steady shear to the material through the top plate/cone. In this mode, the viscosity is measured starting at low shear rates and the shear-rate is slowly increased. An example of a shear-rate sweep experiment is shown in Figure 1.
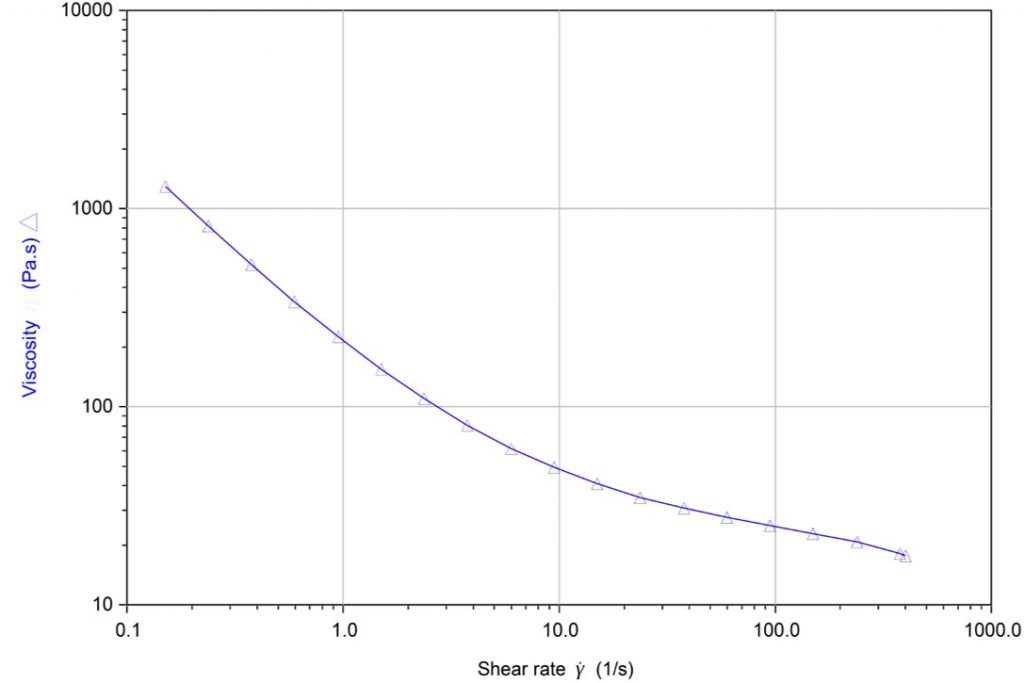
Figure 1. Viscosity as a function of shear-rate for a highly-filled uncured epoxy resin
The data in Figure 1 was obtained in the parallel plate geometry using the shear-rate sweep starting at low shear-rates and incrementally increasing until the sample begins to “spin out” of the gap. During the first few experiments with a new formulation, care must be taken to observe the gap as the shear-rate increases. Flow instability at shear rates greater than 400 sec-1 in this case resulted in the sample deforming out of the gap rendering the data useless above this point. Compared to the stress sweep, the shear-rate sweep is an easier experiment in that the shear-rate can be easily programmed to increase over a used specified shear-rate range. In this case the automatic mode typically yields reproducible data over the user defined shear-rate range.
Let’s compare the two methods using model formulations of epoxy resin filled with spherical silica fillers at various loading levels.
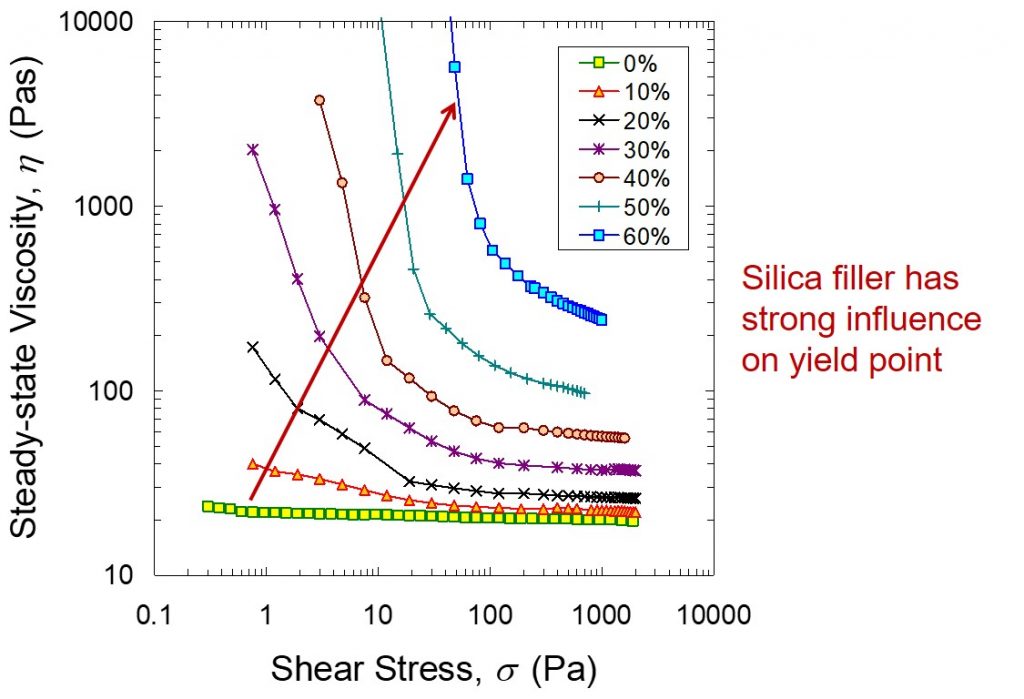
Figure 2. Steady state viscosity as a function of shear stress for an epoxy resin with various levels of silica filler.
In Figure 2, the impact of silica filler on the rheological profile is profound. The yellow/green squares in the lower curve represent the viscosity of the neat epoxy resin (i.e. zero percent filler loading). Note that the viscosity is independent of the shear stress, that is behaves as a Newtonian fluid. Most highly filled resin systems require the resin carrier to have a very low viscosity to allow for dispensing.
As the silica filler loading is increased, two distinct patterns are observed. The first is the sequential development of the yield point. At 10% silica loading, the yield point is not clearly evident. With progressively higher filler loadings, a distinct yield point develops. As we discussed in previous posts, the particle-particle interactions are responsible for the large changes in the viscosity profiles. Note that at intermediate filler loadings, the yield point develops, but the viscosity gradually increases at the higher shear stresses.
For example, at 30 wt% silica loading, there is clearly a yield point, the viscosity drops by 2 orders of magnitude as the shear stress increases, but the viscosity is only a factor of 2 higher than the unfilled epoxy resin at a shear stress of 1000 Pas. (40 Pas versus 20 Pas). At 30% silica filler loading, the material would dispense well at the higher shear stresses, while exhibiting no slumping after dispensing. A great paper by Richard Eley [1] shows the sagging and leveling stresses for a typical paint is in the range of 1-5 Pa (or 10-50 dynes/cm2 in the Eley reference). The data in Figure 2 was obtained by a careful point-to-point shear stress sweep.
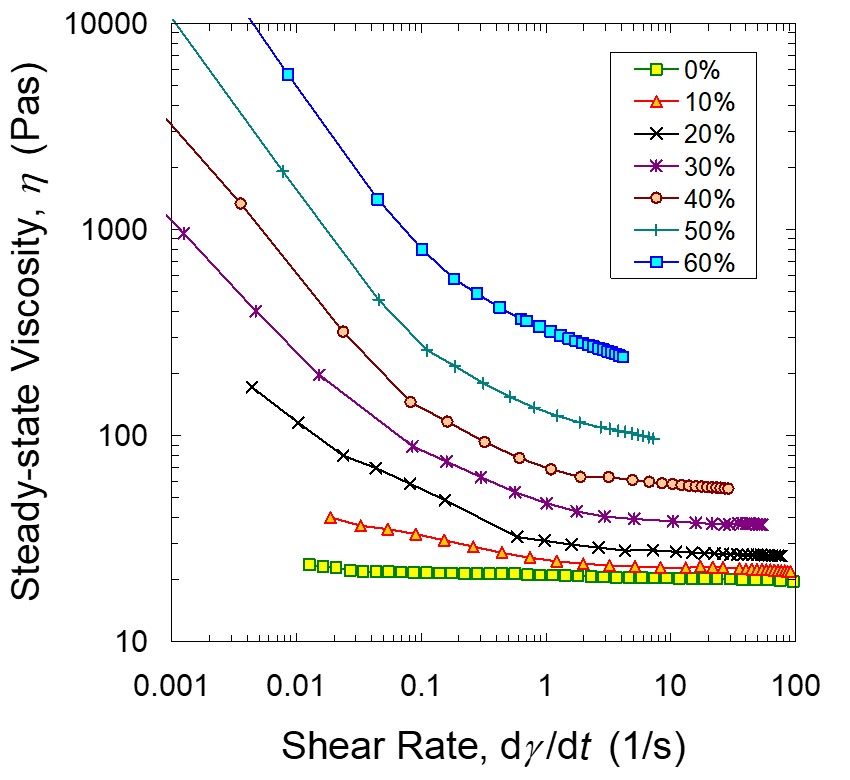
As previously discussed, the automated shear-rate sweep is typically available on commercial rheometers and is an easier experiment to conduct. Figure 3 shows the same highly silica-filled model epoxy formulation as a function of shear rate.
Figure 3. Steady state viscosity as a function of shear rate for an epoxy resin with various levels of silica filler.
In Figure 3, the data shows similar trends as seen in Figure 2, but the assignment of the yield point is not as straightforward. The impact of silica filler loading is still very pronounced and the viscosity is easily measured in the dispensing region. Just as in the data in Figure 3, the viscosity changes by orders of magnitude over the shear rate range largely influenced by the silica particle interactions. The formulator can tailor the rheological profile with the right choice of the base resin (epoxy, acrylate, bismaleimide, etc.) and the filler type and filler loading.
Reference
- R. Eley, Rheology Reviews, 2005 pp 173-240


Leave a Reply