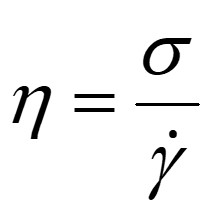
Rheometers are used to determine the viscosity by measuring the stress at a known shear-rate or measuring the shear rate at a known stress. There are two types of torsional rheometers:
- Controlled strain (most common)
- Controlled stress
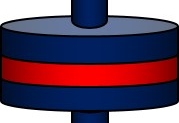
In the case of the strain controlled rotational rheometer, a typical configuration is shown in the following figure:
In this mode, the sample under test is placed between parallel plates (blue in the figure above, but other geometries such as cone-and-plate can also be used). Strain (or deformation) is applied with the direct drive motor and the sample response determines how much torque (stress) is transmitted to the transducer. The strain can be applied using a sinusoidal oscillatory deformation or at a steady shear-rate. It is common to vary the frequency or the shear-rate and measure the viscosity as a function of frequency or shear-rate. Note in this geometry the motor and the transducer are separated.
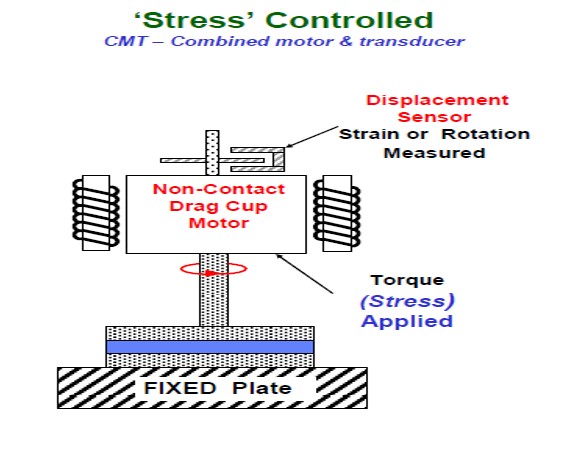
A second geometry is the controlled stress rotational rheometer. The typical configuration is shown in the figure below:
In this geometry, the sample is again placed between the parallel plates (in blue above) but a torque (stress) is applied using a non-contact drag cup motor (to reduce friction losses). Note that both the motor and strain transducer are in the top housing. When the stress is applied, the material responds by deforming (strain) and the displacement is carefully measured using a precise displacement sensor. This is actually a creep measurement since it is analogous to hanging a weight (apply torque or stress) and then measuring the deformation.
A good way to visualize this is to clamp one end of a polymer strip to a fixture, then hang a weight on the other end and measure the deformation (strain) as a function of time. The controlled stress rheometer does the same creep experiment, but in the rotational mode.
In order to measure the viscosity as a function of stress, a series of creep experiments are conducted:
- Apply a stress, wait for steady-state and measure the strain-rate and calculate the steady-state viscosity
- Apply a new stress and repeat
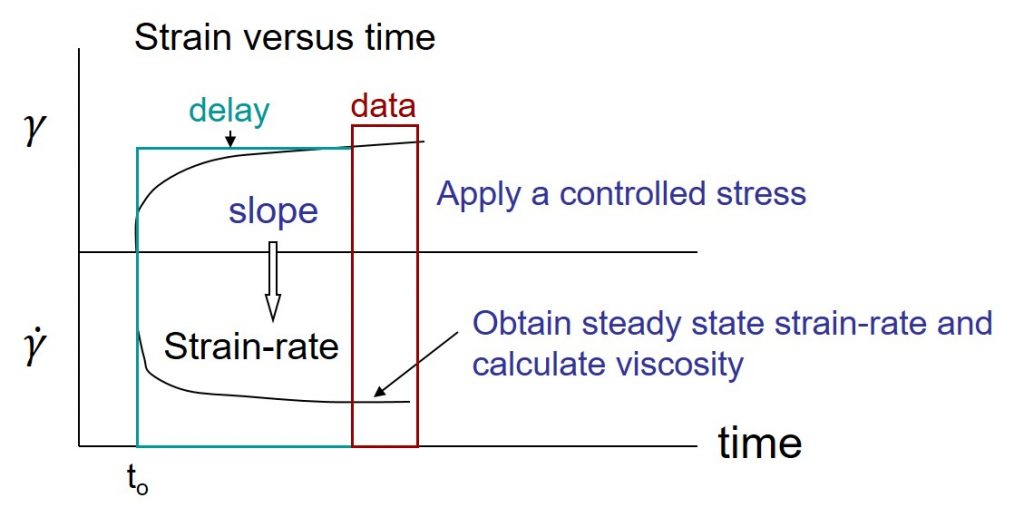
The following figure depicts how a controlled stress flow curve is obtained.
In the figure above, a stress (or torque in a rotational rheometer) is applied at time zero (t0) and the deformation (γ) is measured as a function of time with a displacement sensor in the rheometer. One should note that for viscoelastic fluids, there is a time delay to reach steady state arising from the viscous component. The instrument takes the first derivative to get the shear rate as a function of time, as seen in the bottom half in the figure above. Once the steady state strain is obtained, the instrument uses the steady state strain rate (or sometimes called the shear-rate) to calculate the viscosity.
A typical controlled stress flow curve is obtained by starting with the application of a low stress, determining the strain rate at steady state, calculating the viscosity, and repeating with the application of progressively larger stresses. The next post will discuss how to interpret controlled stress flow curves.


Leave a Reply