 This post will provide a review of the concepts of gelation and vitrification in thermosets. This is important in the processing of many materials used in electronic applications. For example, epoxy mold compounds (EMC) used in a variety of electronic packaging applications are cured in the mold to just past the gel point. As we will see, after gelation, the growing network will not flow so the molded parts can be removed from to mold to increase the molding cycle time. The parts are then placed in a high temperature oven for the post mold bake process to drive the crosslinking reactions to completion.
Gelation
Gelation is a defining characteristic of a thermoset and is controlled by the resin and hardener chemistry. Gelation is the incipient formation of a cross-linked network. A thermoset loses its ability to flow and is no longer processable above the gel point, and therefore gelation defines the upper limit of the work life. The gel point can be calculated if the stoichiometry of the resin and hardeners is known.
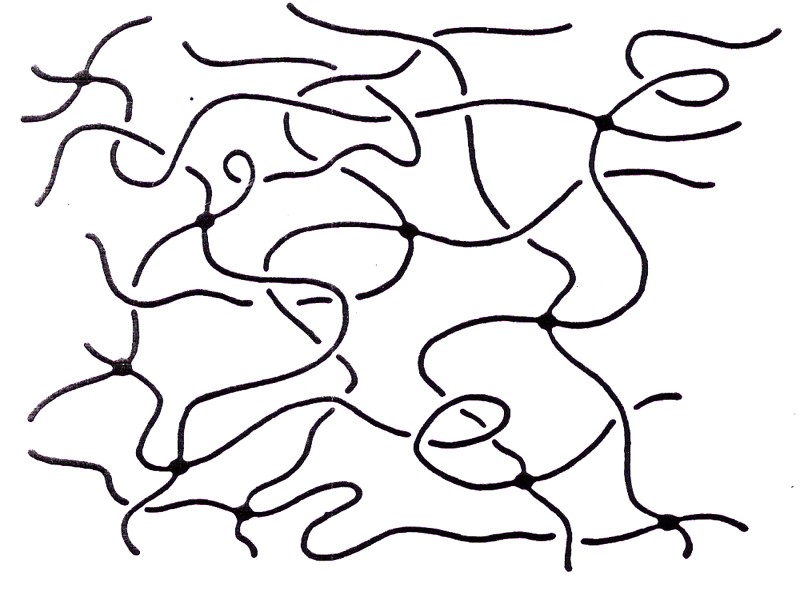
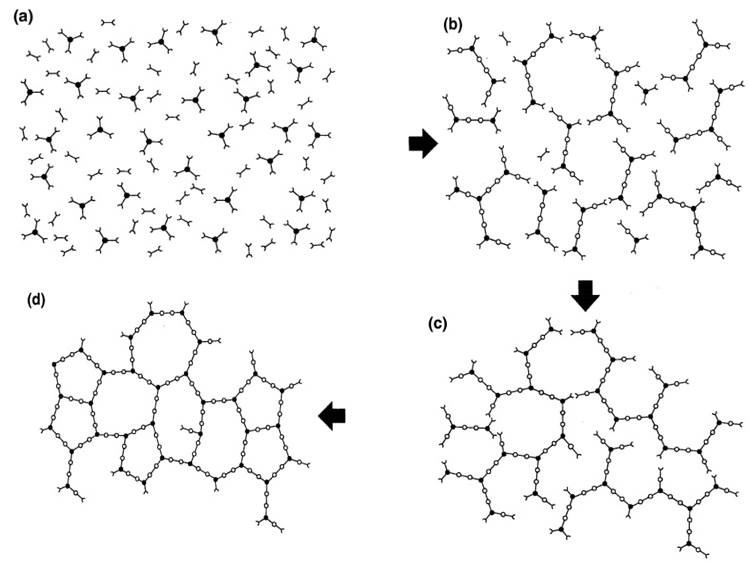
In Figure 1, the curing reaction is represented schematically for a blend of difunctional and trifunctional reactants. Reaction in the early stages of cure {(a) to (b)} produces linear, chain extended and branched molecules and reduces the total number of molecules. Macroscopically the thermoset can be characterized by an increase in the viscosity η as the crosslinking reactions increase the molecular weight. As the reaction proceeds the increase in molecular weight accelerates and all the chains become linked together at the gel point into a network of infinite molecular weight {approximately (c) in Figure 1}.
Figure 1. The curing reaction is represented schematically for a blend of difunctional and trifunctional reactants.
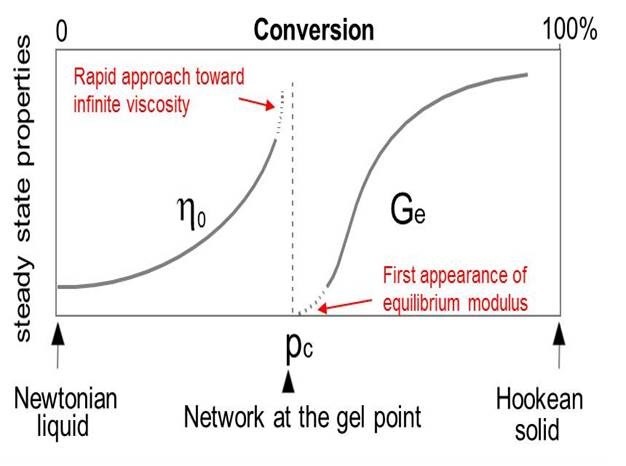
The gel point coincides with the first appearance of an equilibrium modulus (which means it can support a load without flowing) as shown in Fig. 2. Gelation does not affect the rate of cure and reaction continues beyond the gel point {(c) to (d) in Figure 1} to complete the network formation.
Figure 2. Changes in viscosity and modulus during typical thermoset curing [1]
Vitrification
The Merriam-Webster online dictionary defines vitrify as “to convert into glass or a glassy substance by heat and fusion.” In the case of thermosets, the definition is pretty close, since the glassy state can be obtained during cooling from the rubbery state and vitrification can occur under the right conditions during curing. In thermoset curing, vitrification is the development of the glassy state as the curing reaction increases the Tg to the cure temperature. Vitrification occurs when temperature Tg = Tcure. See reference [2]
First, let’s provide some definitions of vitrification in the context of thermosetting polymers:
- Glass formation due to Tg increasing from below Tcureto above Tcure as a result of reaction
- Definition of vitrification: Tg = Tcure
- Only occurs when Tcure< fully cured Tg
- Reversible by heating: liquid or gel back to glass
- Dramatic slowing of rate of cure and the reaction becomes diffusion controlled
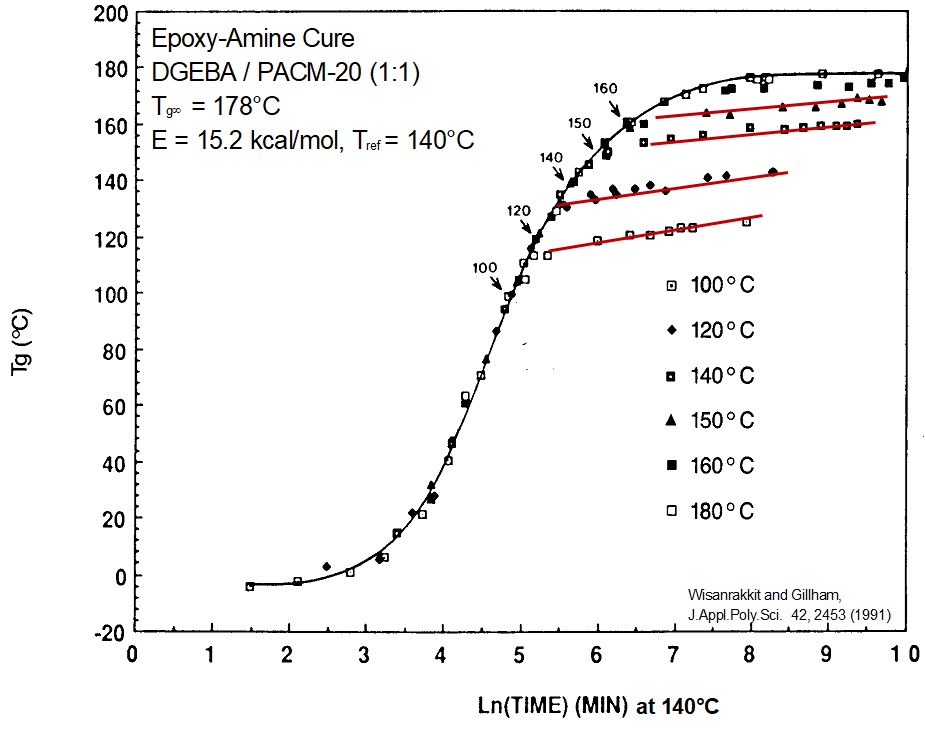
Let’s use Figure 3 to illustrate some key points regarding vitrification during thermoset curing.
Figure 3. Master curve of Tg as a function of curing time at various cure temperatures noted in the legend [2]
Figure 3 is a master curve (using time-temperature superposition) with a reference temperature of 140°C [2]. The small arrows indicate were Tg = Tcure. A few characteristic features are clearly visible. The slopes of the Tg – Time curves are identical at all curing temperatures in the early stages of curing. The overall shapes of the curves are also very similar. The key feature to note is that the increase in the Tg slows dramatically after Tg = Tcure. The red lines in Figure 3 show the cure rate slows dramatically after vitrification. See reference [3] for more details on time-temperature superposition.
As discussed above, the cure rate does not change as the chemical reaction passes through the gel point. This is not the case however with vitrification. As the Tg increases due to the chemical crosslinking, when the Tg exceeds the Tcure, the thermoset begins to transition into the glassy phase. Think of this as a glass transition temperature in reverse, driven by chemistry/crosslinking, not by a temperature change as observed in a typical Tg heating curve by DSC or DMA.
References:
- H. Winter, Polym. Eng. Sci. 27, 1698 (1987).
- Wisanrakkit and Gilham, J. Appl. Poly. Sci., 42, 2453 (1991)
- https://polymerinnovationblog.com/thermoset-characterization-part-8-time-temperature-superposition/


Leave a Reply