Guest Post by Dr. Lawrence Judovits, Arkema, and Dr. R. Bruce Prime
 In the previous posts we presented the characterization of two 5-minute epoxies. In this last post in this series we contrast these fast reacting systems with a slower reacting 60-minute epoxy, and because it is slower reacting with a higher Tg we are able to observe vitrification in addition to cure by both quasi-isothermal DSC (QiDSC) and MTDSC at a very slow heating rate.
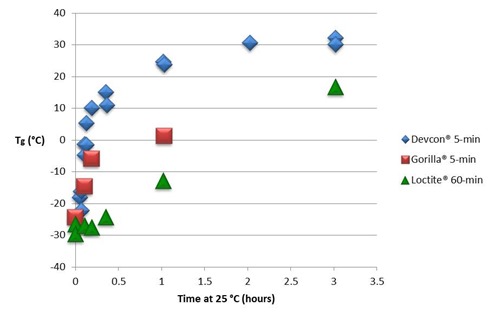
In Fig. 1 we compare the Tg – time curves for the three epoxies. Tg begins to increase almost immediately for the two 5-minute epoxies which then separate as the faster Devcon® epoxy approaches its full cure Tg of 35 to 40 °C and the Gorilla® epoxy lags behind. The Loctite® 60-minute epoxy undergoes a much slower increase in Tg and shows characteristics of autocatalytic cure where the rate of increase in Tg accelerates with time in the early part of cure.
Figure 1. RT vs time for three epoxies
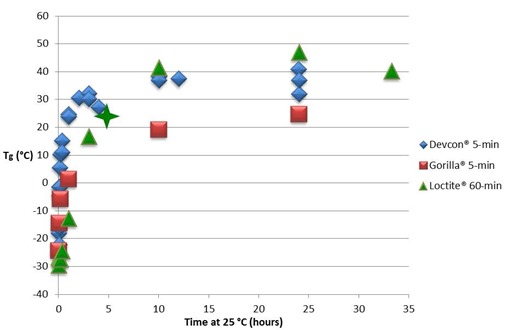
Figure 2 below shows the same data over a longer time period. Even though both 5-minute epoxies will vitrify during cure at 25 °C, their full cure Tg is only 5 to 15 °C above the cure temperature of 25 °C, not enough of a delta to prevent the completion of cure in this time period. For the Loctite® 60-minute epoxy full cure Tg is around 54 °C, about 30 °C higher than the cure temperature and therefore sufficient to slow the reaction significantly upon vitrification. From QiDSC at 25 °C (see Fig. 5 below) the time to vitrify (tvit) equals 4.8 hours, marked with a 4-pointed star on the curve below. Following vitrification, Tg advances another 15 to 20 °C in 33 hours, but remains about 15 °C below the full cure Tg .
Figure 2. Tg vs. time (hours) over longer time period. Vitrification time of Loctite® 60-minute epoxy (see Fig. 5 below) is marked with the 4-pointed star at Tg = Tcure = 25 °C.
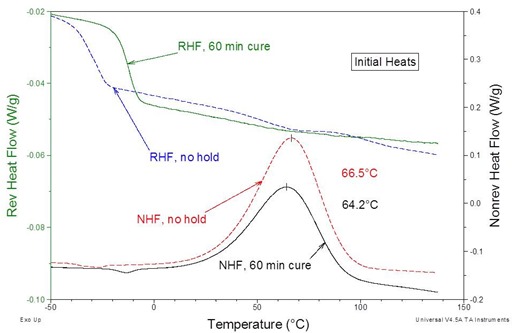
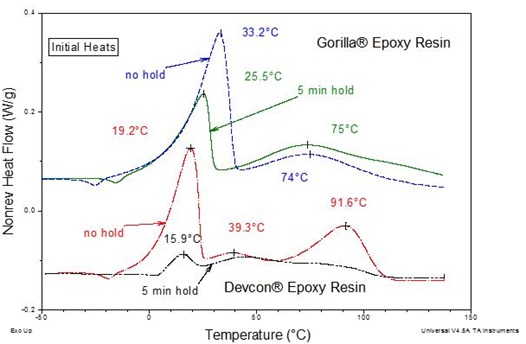
Figure 3 shows MDSC curves for Loctite® 60-minute epoxy immediately after mixing and after 60 minutes at 25 °C. This is similar to the Devcon® and Gorilla® epoxy curves immediately and after 5 minutes at 25 °C as was observed in Part 4. Also notice the single symmetric exotherms illustrating the simpler cure vis-à-vis the 5-minute epoxies where multiple complex exotherms were noted as seen in Fig. 4 below.
Figure 3. Loctite® 60-minute epoxy, immediately after mixing and after a sixty minute cure at 25 ˚C. The MTDSC parameters were a 2 °C/min heating rate with an amplitude of ± 0.212 ºC and a period of 40s.
Figure 4. Nonreversing heat flow for 5-minute epoxies after mixing and after a five minute cure at 25 ˚C. The MTDSC parameters were a 2 °C/min heating rate with an amplitude of ± 0.212 ºC and a period of 40s.
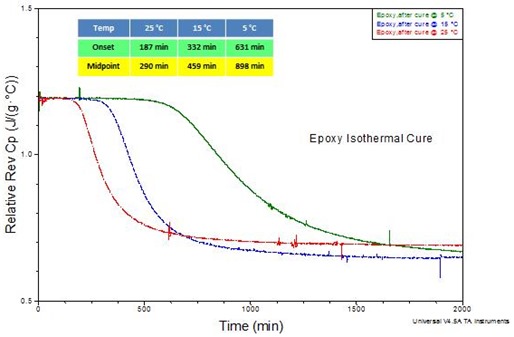
Figure 5 shows the reversing heat capacity for Loctite® 60-minute epoxy at 5, 15 and 25 °C. This information is important since curing results in the glass transition temperature increasing until vitrification occurs at Tg = Tcure. Based on this definition it follows that at the time that vitrification occurs, tvit, Tg = 5, 15, and 25 °C, respectively, i.e. vitrification occurs at higher Tg (and thus higher conversion) with increasing cure temperature. Following vitrification the kinetics change from chemically controlled to diffusion controlled, typically resulting in a 2 to 3 order of magnitude reduction in the rate of cure vis-à-vis the same reaction under chemical control. In the glassy state beyond vitrification physical aging as well as additional cure will take place.
Figure 5. Quasi isothermal DSC (QiDSC) of Loctite® 60-minute epoxy at 5, 15, and 25 °C. Amplitude = ±0.50 °C, period = 100 seconds.
Use of the QiDSC mode allows one to monitor the progress of cure at a particular temperature and independently measure vitrification. Upon vitrification any shrinkage or thermal stresses, residual solvents or absorbed water will be frozen in. Heating to above the glass transition temperature will relieve these stresses, allow evaporation of trapped volatiles and permit any additional curing to take place.
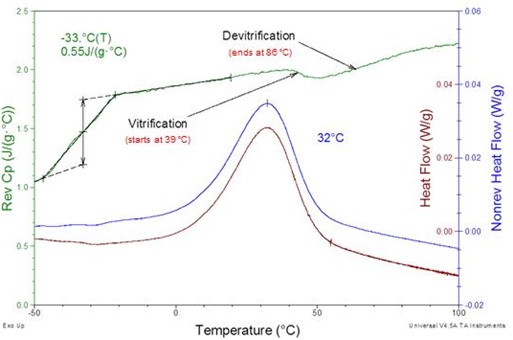
When a thermosetting material is heated in a DSC experiment there is a competition between the heating rate and the cure rate. In practice common heating rates like 10 °C/min exceed the cure rate throughout the entire cure so that the experimental or DSC temperature is always higher than the continuously increasing Tg. The two rates only become competitive at heating rates below about 2 °C/min. When the heating rate is slow enough Tg will increase faster than the experimental temperature, vitrification will occur and cure will continue in the glassy state until full cure is achieved. We observe this phenomenon in the Loctite® 60-minute epoxy heated at a ramp rate of 0.2 °C/min (Fig. 6). In the reversing heat capacity (Cpr) curve we observe the initial Tg after mixing of -33 °C and the onset of cure starting after the end of the glass transition interval. Close to 40 °C the liquid/rubbery heat capacity starts to decrease with the onset of vitrification. Cure continues in the glassy state until it is complete and Cpr returns to the liquid/rubbery heat capacity near 85 °C. Note that vitrification followed by devitrification during cure observed in the Cpr curve is not observed in the heat flow curve, i.e. this phenomenon would not be observed in standard DSC. Experiments like this are important in two respects. One is to determine the minimum heating rate for a multiple heating rate study where it is necessary to heat fast enough so the entire cure occurs under chemical control. Otherwise the occurrence of vitrification will invalidate the kinetic results. The other is to identify an appropriate heating rate for reactive thermoset processing (RTP). RTP involves two stages. In the first, parts are partially cured in expensive fixturing, e.g. to align an optical fiber. When the sample has gelled and Tg is high enough so the part can be removed from the fixture, freeing it up to start more parts, its cure can be finished with several other parts at a heating rate that maintains the parts in the glassy state so the fibers stay aligned.
Figure 6. Loctite® 60-minute epoxy heated at 0.2 °C/min. Amplitude = ±0.021 °C, period = 40 seconds
This finishes our 6 part blog on the use of MTDSC to follow thermoset cure and to use commercial readily available epoxies as examples. Throughout our blog the power of MTDSC was shown multiple times by utilizing its unique ability to separate the glass transition from the cure exotherm.
Devcon® is a registered trademark of Chemical Development Corporation; Gorilla® is a registered trademark of Lutz File & Tool Co,; Loctite® is a registered trademark of Henkel Corporation.

Leave a Reply