Guest Post by Dr. R. Bruce Prime
 In the previous post we showed how MTDSC in the heating mode can be used to provide insight into the cure of thermosets that cannot be obtained by standard DSC. Here we show how MTDSC in the quasi-isothermal or QiDSC mode can be used to characterize thermoset cure.
Isothermal measurements are often preferred when phenomena take time to develop or when constant temperature helps to simplify the analysis. Cure kinetics is one such example. In standard DSC isothermal experiments are very useful to measure both conversion and rate of conversion vs. time at constant temperature. Such data can be fit to rate equations for nth order or autocatalytic kinetics. By repeating such experiments at a series of temperatures a complete kinetic analysis of conversion as a function of time and temperature, a = f(t,T), can be developed. When the cure temperature is less than the Tg for the fully cured thermoset, i.e. when Tcure < Tg¥, vitrification will occur and the reaction will slow down considerably. This can be both a bad thing and a good thing. Bad, when vitrification prevents a thermoset from reaching full cure in a reasonable time, and good when cure in the glassy state allows a part to maintain dimensional stability without expensive fixturing, as discussed in Part 2 of this series.
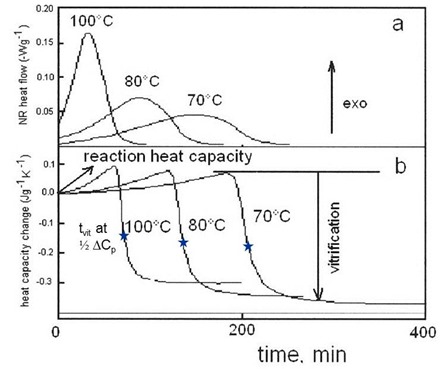
In the figure below the NHF curves in a are similar to standard DSC curves and contain the same information. For example, the cure of this epoxy system is clearly autocatalytic as evidenced by the occurrence of the maximum reaction rate well into the reaction, and not at t = 0 characteristic of nth order reactions. The data is high quality and lends itself to a kinetic analysis. However, what is not readily apparent in these curves is the occurrence of vitrification that causes the reaction to slow down considerably before full cure is achieved. The unique ability of MTDSC to separate the reversing and nonreversing components of the DSC curve allows vitrification to be clearly observed in the reversing heat capacity (Cpr) curves, from the RHF signal, separate from the cure exotherm in the NHF curves. With that information and upon close inspection the reaction can be seen to slow down following that transition. These data can now be used to characterize the cure reaction under chemical control and the transition to diffusion control following vitrification.
QiDSC of diglycidal ether of bisphenol A (DGEBA) and methylenedianiline (MDA) at equal stoichiometry (Tg¥ » 170 °C). ±1°C/60sec.From Swier et al., J. Appl. Polym. Sci. 91, 2814 (2004).
Below is a general kinetic equation for autocatalytic cure
where k1 is the rate constant for cure accelerated either by catalyst that is naturally present, e.g. impurities on particle surfaces, or that is purposely added, and k2 is the autocatalytic rate constant. Note that at t=0 a=0 and this equation reduces to:
Further note that:
where dH/dt is the ordinate of the DSC curve. Thus k1 can be evaluated directly from the DSC curve at t=0.
In the case illustrated below measurements were made utilizing an MTDSC technique known as TOPEM. TOPEM is different from MDSC; instead of a sinusoidal temperature modulation a stochastic temperature modulation is superimposed on a DSC ramp as seen in the figures below:
MDSC modulation (left) compared with TOPEM modulation (right). Courtesy J. Schawe, Mettler-Toledo.
Whereas MDSC utilizes a single frequency modulation, TOPEM employs a spectrum of frequencies. As with MDSC, a frequency spectrum of reversing and nonreversing signals can be determined as well as the quasistatic (measurement at zero frequency) heat capacity.
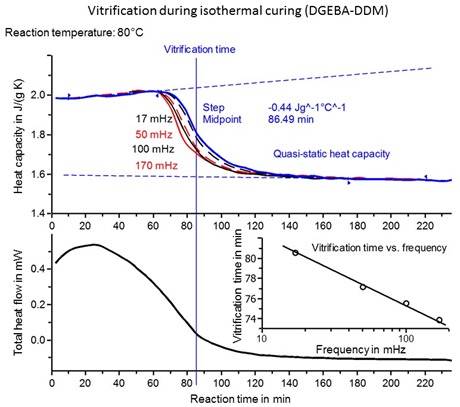
The figure below shows isothermal cure for a different epoxy-amine system. From the THF curve we see that the maximum rate occurs at approximately 25 minutes into the reaction, again indicative of an autocatalytic reaction. Again note that the rate constant k1 can be determined from the ordinate at t = 0. A feature of TOPEM is the ability to sort out heat capacity values as a function of frequency. In this case we see that tvit decreases by ~6 °C with an order of magnitude increase in frequency, right in line with classical behavior of the glass transition. Note that these values can now be compared with those obtained by DMA and dielectric measurements at vastly different frequencies.
Vitrification during isothermal cure of DGEBA-DDM epoxy amine. TOPEM version of MTDSC. Courtesy J. Schawe, Mettler-Toledo.
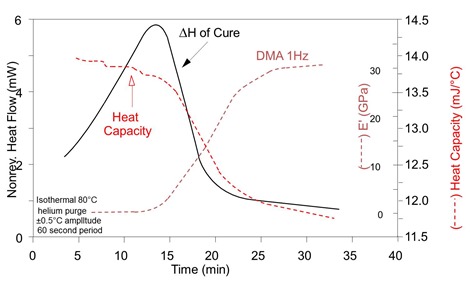
The curve below shows a similar isothermal cure where the DSC curve is overlayed with the DMA curve. Vitrification can be observed at 18-19 minutes at the midpoint of the step decrease in the reversing heat capacity, i.e. at ½DCp, as well as the midpoint of the step increase in the storage modulus. Note the very slow but measurable rate of cure in the glassy state, from the slope of the NHF curve, beyond about 25 minutes when vitrification is complete.
 MTDSC and DMA of thermoset during isothermal cure. Courtesy TA Instruments.
In our next post we illustrate the application of MTDSC to a common and widely available Five-minute Epoxy.
Dr. Lawrence Judovits is acknowledged for his contribution to this post.


![clip_image002[7] clip_image002[7]](https://polymerinnovationblog.com/wp-content/uploads/2015/06/clip_image0027_thumb.png)


Leave a Reply