Guest Post by Huan Lee, Lambient Technologies
The curing behavior of Bulk Molding Compound (BMC) was observed using a high-speed dielectric cure monitor that can follow thermosets that react to completion in less than a minute. Bulk Molding Compound is generally the same material as Sheet Molding Compound (SMC) but in bulk form, so the analysis of results can apply to SMC as well.
Samples of BMC were placed on disposable dielectric/conductivity sensors, shown in Figure 1, then compressed and cured for separate runs at 130°C,140°C, 150°C, 160°C and 170°C. Previous tests had identified 100 Hz as an optimum excitation frequency for cure monitoring.
Figure 1. Mini-Varicon disposable sensor
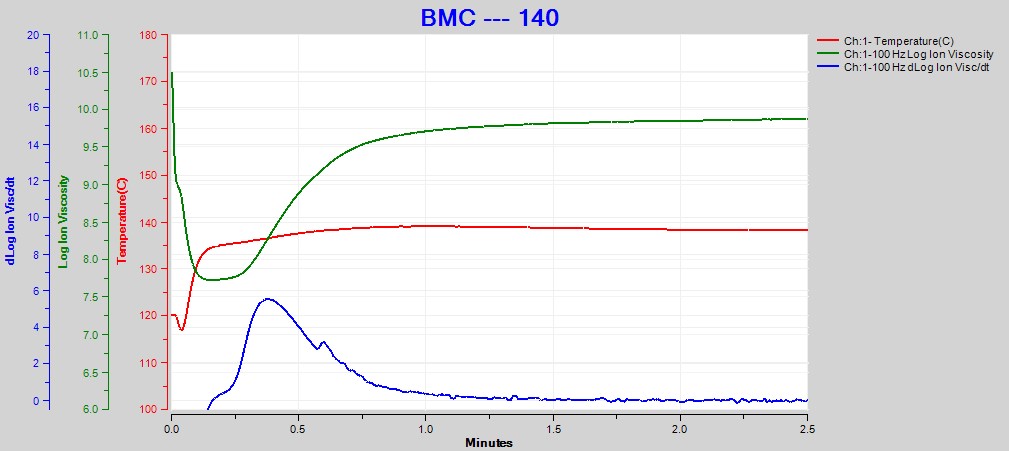
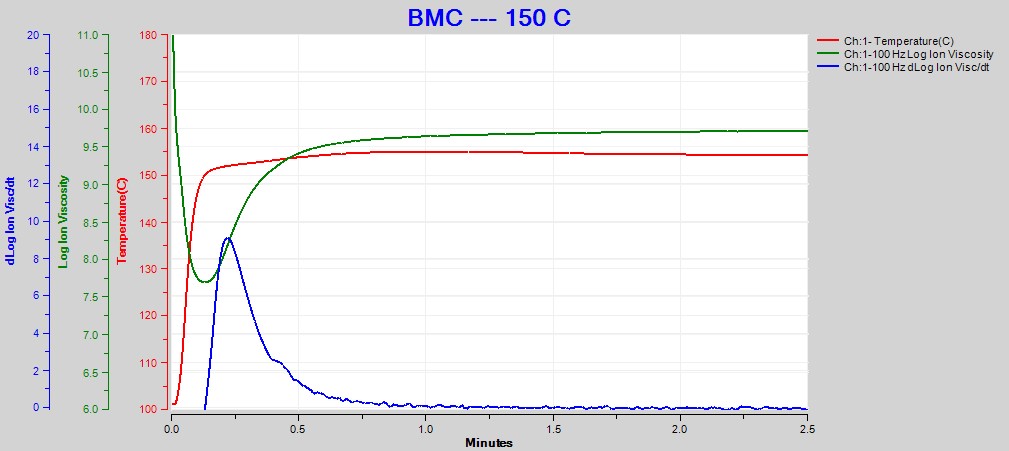
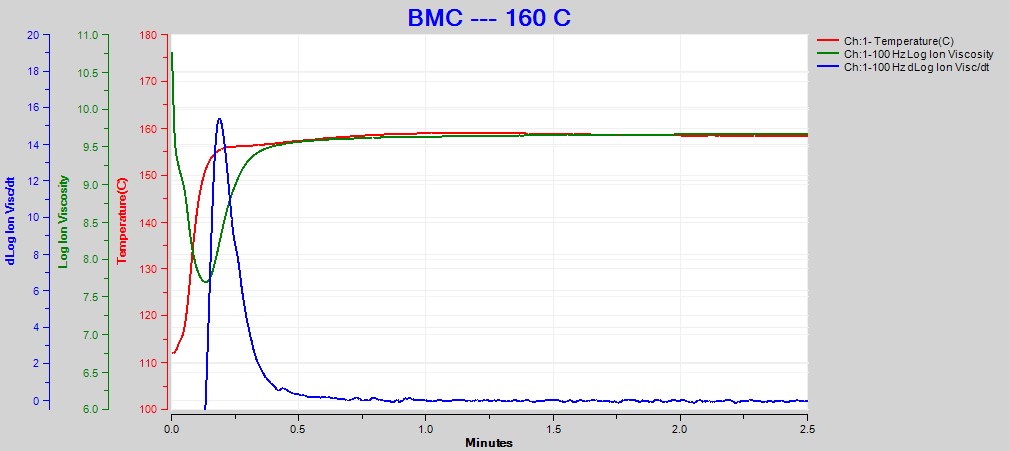
Figures 2, 3 and 4 show data from the cures of BMC at 140°C, 150°C and 160°C, respectively. Plots for the cures at 130°C and 170°C were omitted for brevity. For each cure log (ion viscosity) and slope of log (ion viscosity)—which I will call log (IV) and slope for simplicity—follow the typical behavior for a thermoset.
Figure 2. Dielectric data at 100 Hz for BMC cure at 140°C
Figure 3. Dielectric data at 100 Hz for BMC cure at 150°C
Figure 4. Dielectric data at 100 Hz for BMC cure at 160°C
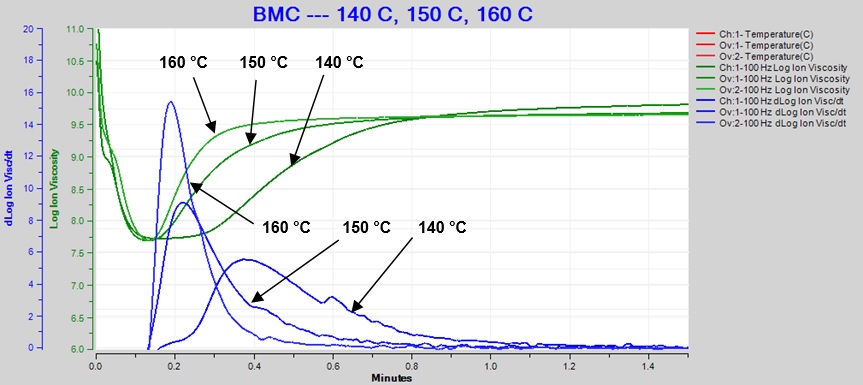
Figure 5 overlays the log (IV) and slope curves for 140°C, 150°C and 160°C, showing the sensitivity of dielectric cure monitoring to changes due to temperature differences.
Figure 5. Overlay of 140 °C, 150 °C and 160 °C BMC cure data at 100 Hz
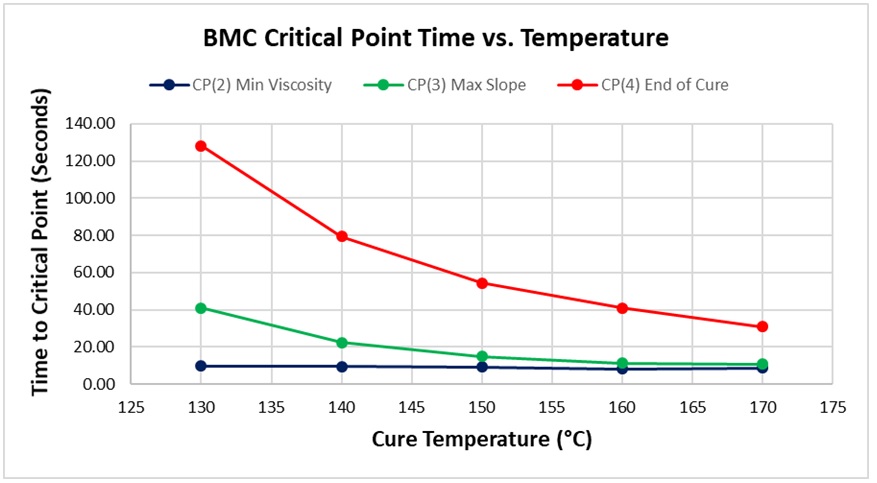
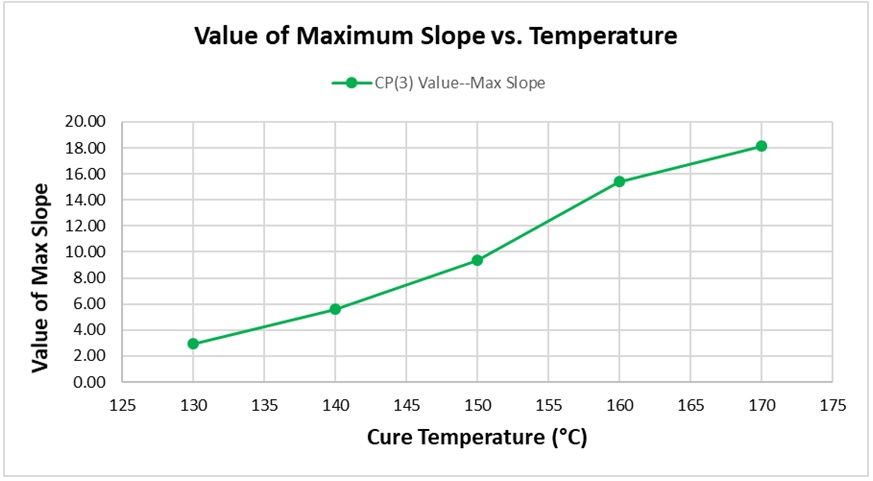
As expected for a thermally activated reaction, the log (IV) curves rise and flatten more quickly with increasing temperature. The ion viscosity minimum—CP(2)—and the peak slope—CP(3)—also occur sooner at higher temperatures. Furthermore, the peak value of CP(3), which is related to the maximum reaction rate, increases with temperature.
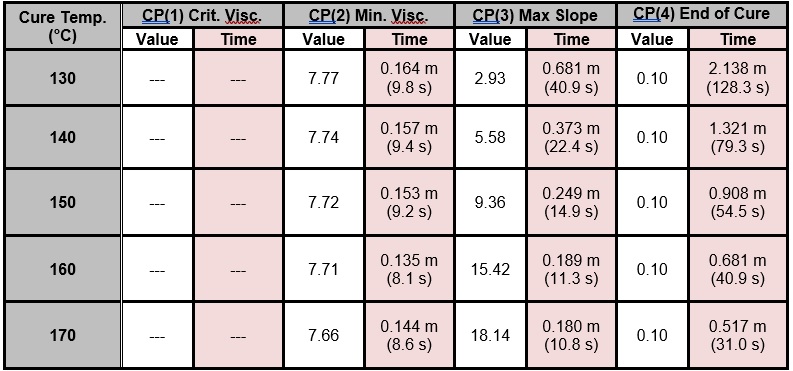
Critical Points that characterize each cure, for the full temperature range of 130 °C – 170 °C, are shown in Table 1 and plotted in Figure 6, with the following notes:
- The time to CP(1) indicates onset of flow and is not a measure of cure, so CP(1) data are not shown
- The slope of 0.1 to define CP(4) was chosen arbitrarily; in fact, a user must determine a suitable slope based on the needs of the application to indicate end of cure.
Table 1. Critical Points from BMC cure monitoring
Figure 6. Critical Point time vs. cure temperature for BMC
Figure 7 shows how the maximum value of slope increases with temperature. Again, this relationship is expected because the height of CP(3) is a relative measure of the maximum reaction rate.
Figure 7. Value of maximum slope vs. cure temperature for BMC
Temperature measurements, which vary with the thermal environment, configuration of the mold, volume of material and other factors, have sometimes been used to indirectly observe cure. In fact, several brands of thermoset curing ovens market their use of thermocouples for exactly this purpose.
In contrast, dielectric cure monitoring (DEA) directly measures material properties—ion viscosity, in particular—that indicate cure, giving immediate, real‑time insight. Because of the ease and repeatability of DEA, several manufacturers of BMC and SMC use dielectric cure monitoring in their quality control departments. Samples of each batch of BMC or SMC are tested at a controlled temperature. Critical Points like those listed in Table 1 characterize the ion viscosity curve and these Critical Points are recorded to monitor consistency in the material.
Good batches of BMC or SMC will have Critical Points that stay within a narrow range. Results outside this range suggest a process that may be out of control, warranting investigation or remediation. In this way, by using dielectric cure monitoring, a manufacturer can maintain the quality of outgoing material.
For more information on dielectric cure monitoring, please contact Lambient Technologies.


Leave a Reply