Guest Post by Huan Lee, Lambient Technologies
In my first post we saw dielectric cure monitoring (DEA) uses AC signals to measure the electrical properties of a thermoset or composite. Under certain circumstances when materials are very conductive, a phenomenon called electrode polarization (EP) may cause abnormally high apparent ion viscosities [1].
Electrode polarization is the accumulation of charge against the electrodes, which occurs when the material under test:
- Has low ion viscosity (high ionic conduction) at low frequency
- Has a non-conductive film, an oxide layer or an electrochemical potential barrier, resulting in an insulating boundary layer
Figure 1 is the electrical model of a sensor with boundary layers, which introduce a pair of capacitors between the electrodes and the Material Under Test (MUT). Because capacitors pass only AC signals, DC measurements are not possible.

Figure 1. Electrical model of a sensor with boundary layers
Figure 2 shows a Mini-Varicon dielectric/conductivity sensor, which I used to study “five-minute” epoxy with a cure monitor capable of both AC and DC measurements.
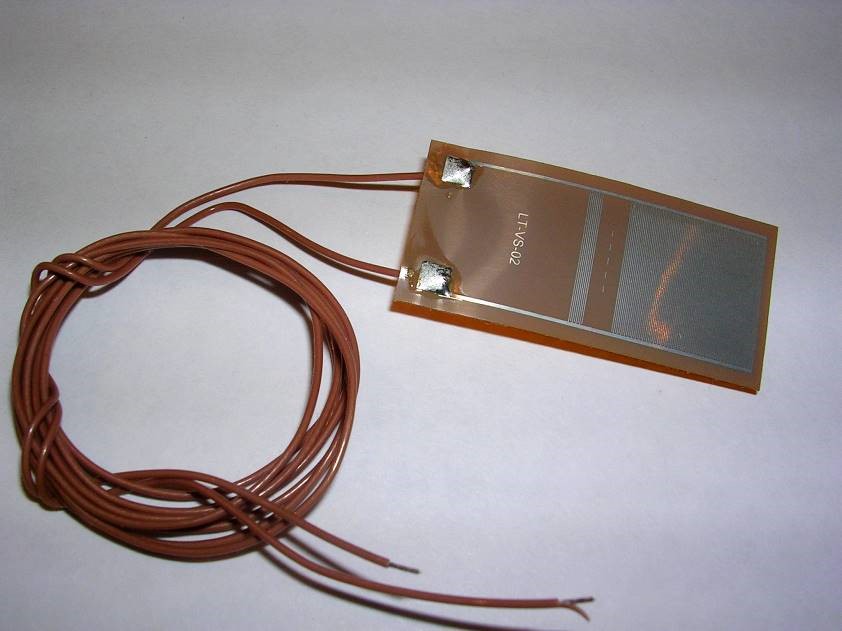
Figure 2. Mini-Varicon dielectric/conductivity sensor
Figure 3 is a plot of resistivity from AC measurements of five-minute epoxy. All data are plotted against an axis labeled ion viscosity and may collectively be called ion viscosity.

Figure 3. Ion viscosity / resistivity during cure of 5-minute epoxy
Three features are apparent in Figure 3:
- Curves that overlap or nearly overlap, indicating the dominance of frequency independent resistivity, or true ion viscosity
- Caused by movement of mobile ions
- Correlates well with cure state
- Curves that diverge, indicating the dominance of frequency dependent resistivity
- Caused by rotation of dipoles
- Does not correlate well with cure state
- Distortion of 1 Hz and 10 Hz curves around 2 minutes due to electrode polarization
At the beginning of cure, electrode polarization causes considerable distortion in the 1 Hz data, shown in the expanded plot of Figure 4. This distortion changes the expected single minimum in resistivity/ion viscosity to a peak with two local minima.
Data from 10 Hz measurements show distortion to a much lesser degree because the boundary layer effect decreases with increasing frequency. Furthermore, measurements at even higher excitation frequencies—1 kHz to 10 kHz—show no distortion and correctly identify the ion viscosity minimum.
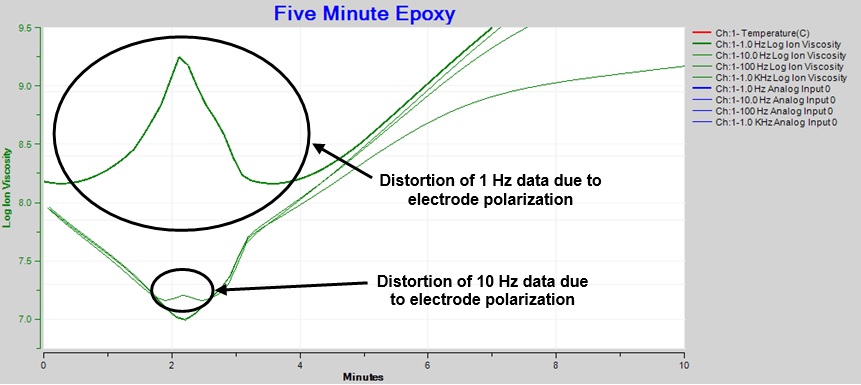
Figure 4. Expanded ion viscosity / resistivity around time of minimum viscosity
In many cases it is possible to mathematically restore information about cure [2]. Figure 5 shows how boundary layer correction—also called electrode polarization (EP) correction—recovers affected data. After EP correction, 1 Hz and 10 Hz ion viscosity show a proper minimum and are now consistent with the higher frequency data.
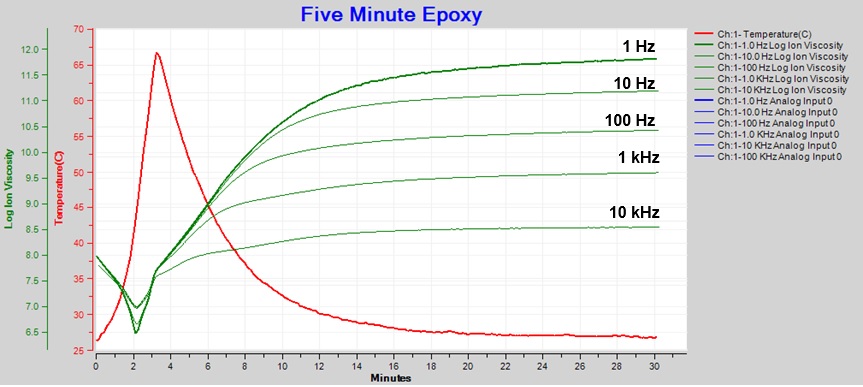
Figure 5. Resistivity / ion viscosity with boundary layer (EP) correction
After applying boundary layer correction, it is possible to use only 1 Hz ion viscosity to follow the entire five-minute epoxy cure, as shown in Figure 6.
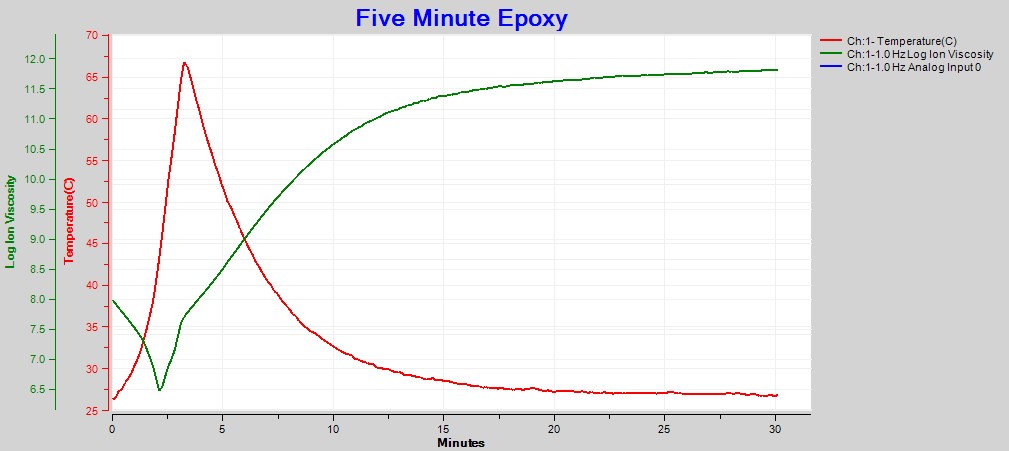
Figure 6. 1 Hz ion viscosity with boundary layer (EP) correction
Figure 7 compares simultaneous AC and DC measurements of five-minute epoxy. Toward the end of cure, AC and DC results are similar and overlap, showing that excitations of 1 Hz or less represent frequency independent resistivity—true ion viscosity—which correlates with cure state.
We have seen the boundary layer effect decreases with increasing frequency, so conversely it increases with decreasing frequency. As a result, we expect to see maximum distortion at DC (0 Hz), which is apparent in Figure 7.
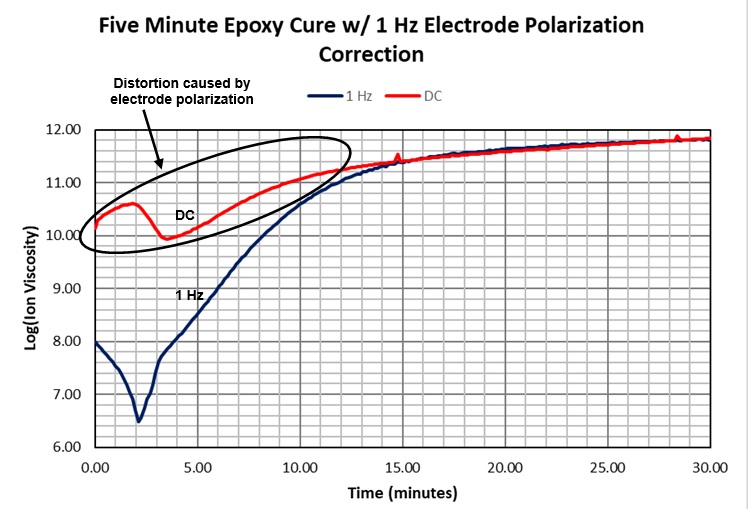
Figure 7. DC and 1 Hz ion viscosity of 5-minute epoxy cure
Although its effects were not understood until relatively recently, electrode polarization is a common phenomenon. Figure 8 shows another example, this time for the cure of an epoxy-fiberglass prepreg. As with the five-minute epoxy, distortion increases as frequency decreases and is greatest for DC measurements. While it is possible to correct the affected AC data, it is not possible to correct DC data [2,3].
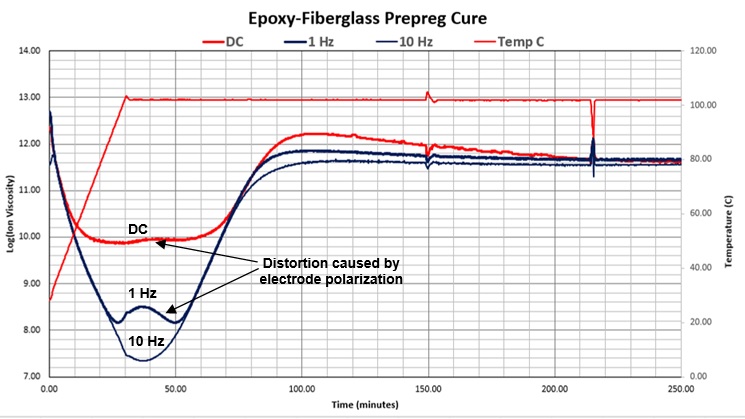
Figure 8. DC 1 Hz and 10 Hz ion viscosity of epoxy-fiberglass prepreg cure
The amount of distortion due to electrode polarization depends on the conductivity of the Material Under Test, the excitation frequency and the thickness of the boundary layer compared to the dimensions of the electrodes. While the boundary layer effect may not always appear, it is important to recognize its characteristics to avoid misinterpreting data when it is present.
References
- Day, D.R.; Lewis, J.; Lee, H.L. and Senturia, S.D., Journal of Adhesion, V18, p.73 (1985)
- Lambient Technologies application note AN2.16, “Electrode Polarization and Boundary Layer Effects”
- Lambient Technologies application note AN2.40, “Electrode Polarization and Boundary Layer Effects with AC and DC Cure Monitoring”

Leave a Reply