Guest Post by Huan Lee, Lambient Technologies
Huan Lee from Lambient Technologies will provide a series of guest posts covering new advances in dielectric cure monitoring, also known as Dielectric Analysis (DEA).
DEA is the only method that can measure cure state in real time under actual process conditions, DEA can generate results in the laboratory that are directly applicable in manufacturing. Dielectric cure monitoring is a broad area with many applications, so I have returned with a second series about the subject. To see the original series, beginning with Jeff Gotro’s posts, please go to the following link:
https://polymerinnovationblog.com/dielectric-cure-monitoring-part-1-background/
In brief, DEA measures a thermoset’s resistivity and permittivity, which are the material’s dielectric properties. Resistivity itself has a frequency independent component due to the flow of mobile ions and a frequency dependent component due to the rotation of stationary dipoles. Although often called DC resistivity for brevity, frequency independent resistivity actually extends across a range of frequencies that includes DC (0 Hz).
Why is this distinction important? Because frequency independent resistivity correlates with cure state, it is a useful material probe. By taking advantage of optimal frequencies, AC measurements—unlike DC methods—can deal with distortion of data caused by electrode polarization and can work through release films and vacuum bags. I will discuss these topics in later posts.
The term ion viscosity (IV) is a synonym for frequency independent resistivity and from this point I will use ion viscosity instead of the more unwieldy frequency independent resistivity.
Characteristics of thermoset cure
In many cases the change of log(IV) is proportional to the change of mechanical viscosity before gelation and proportional to the change of modulus after gelation. Consequently, DEA can observe cure throughout a process.
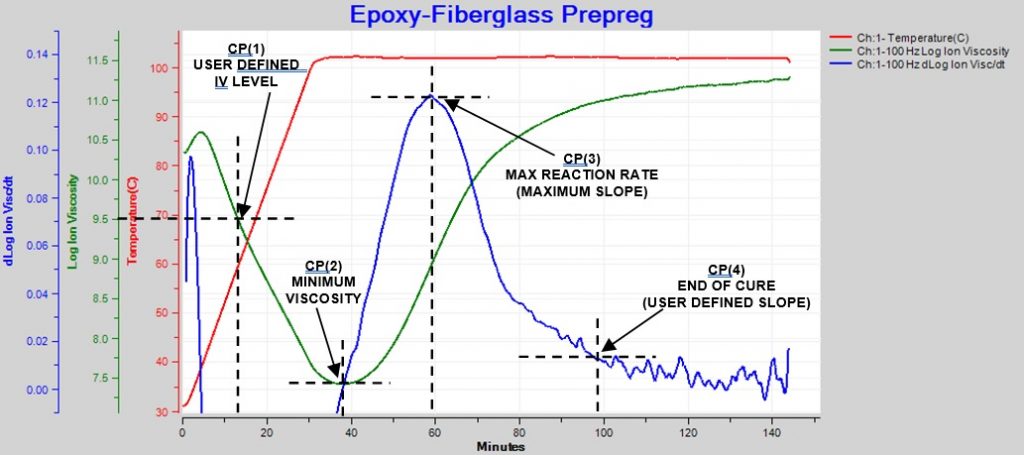
Figure 1 shows the behavior of a typical thermoset with one temperature ramp and hold.
Figure 1. Ion viscosity and slope of ion viscosity for thermoset cure during thermal ramp and hold
At first, as temperature increases, ion viscosity decreases because the thermoset becomes more fluid and therefore less resistive. The reaction rate increases as the material becomes hotter. At some time, the increase in ion viscosity due to polymerization overcomes the decrease in ion viscosity due to rising temperature. This point is the ion viscosity minimum, which also occurs at about the time of minimum mechanical viscosity.
After the minimum point, ion viscosity increases until the concentration of unreacted monomers diminishes, crosslinking occurs and the reaction rate decreases; consequently, the slope of ion viscosity also decreases and eventually ion viscosity will have zero slope when cure has stopped completely.
Four Critical Points characterize the dielectric cure curve:
- CP(1)—A user defined level of log(IV) to identify the onset of material flow.
- CP(2)—Minimum ion viscosity to identify the time of minimum mechanical viscosity.
- CP(3)—Maximum reaction rate, often used as a signpost associated with gelation. The height of CP(3) is a relative measure of the reaction rate.
- CP(4)—A user defined slope of log(IV) to identify end of cure.
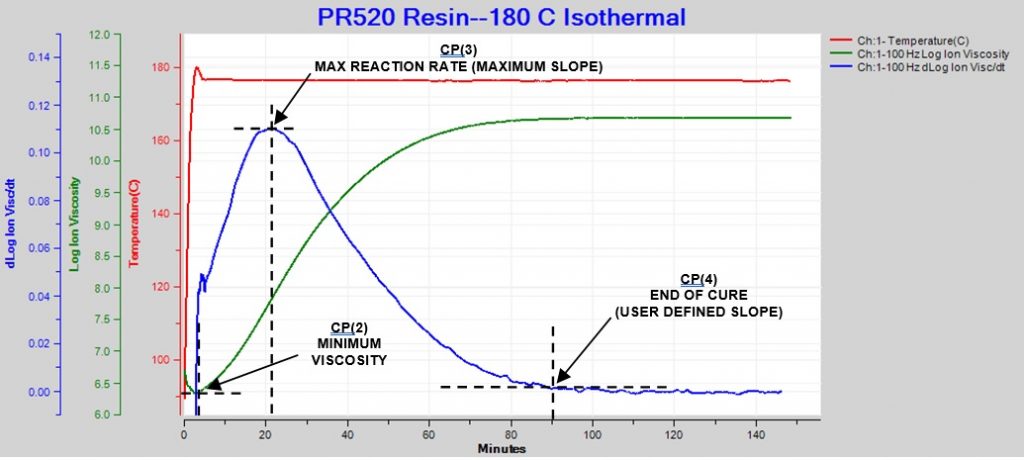
The response is slightly different when the material is essentially isothermal, as shown in Figure 2. In this case, CP(1) either is meaningless or occurs at t = 0, immediately after the application of heat, when material flows to make contact with the sensor. Minimum ion viscosity also occurs at t = 0 or shortly afterwards because cure begins immediately.
For isothermal cures, CP(3) and CP(4) are conceptually the same as for ramp and hold conditions.
Figure 2. Ion viscosity and slope of ion viscosity for thermoset cure during isothermal processing
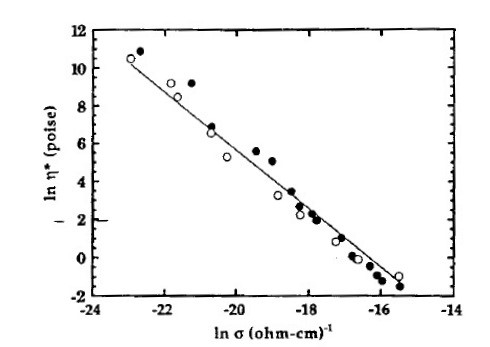
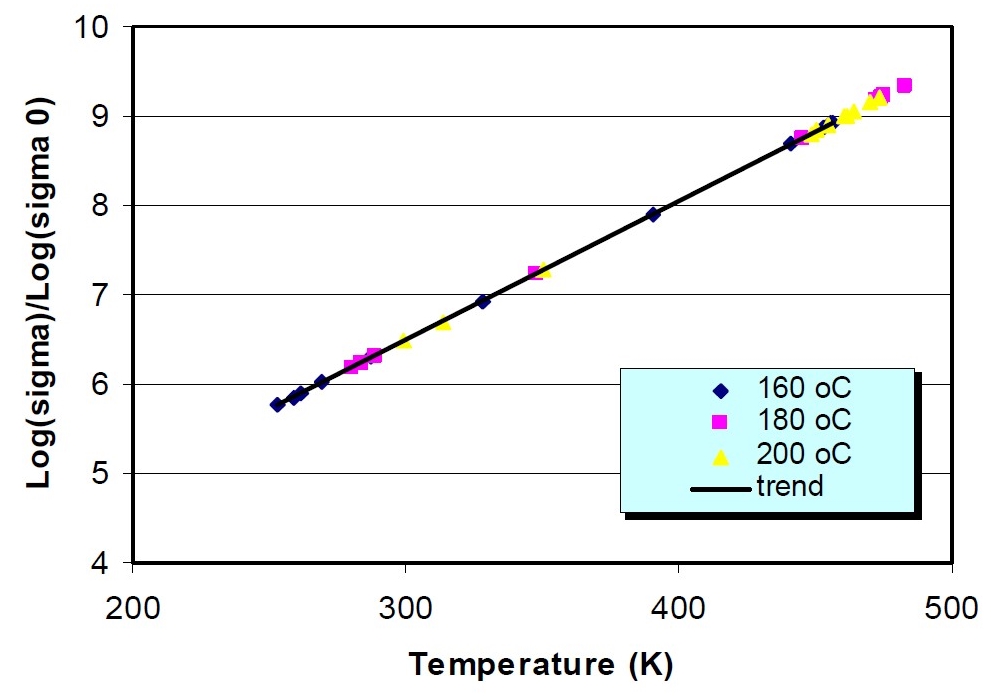
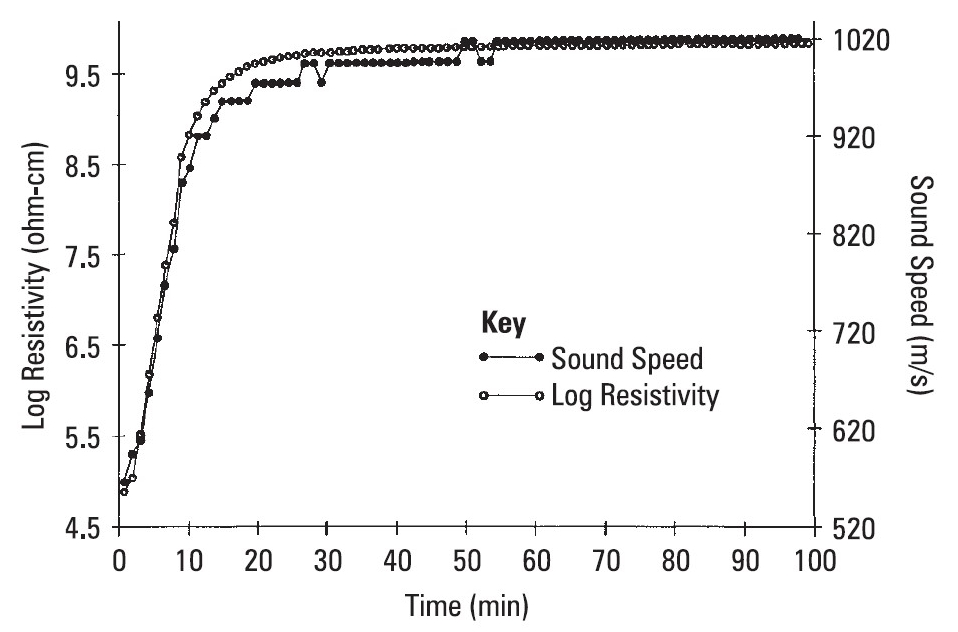
The correspondence of DEA with other methods has been well established and Figures 3, 4 and 5 show some published examples, comparing viscosity, glass transition temperature and sound speed, respectively, with ion viscosity.
Figure 3. Viscosity vs. conductivity (ion viscosity = 1/conductivity) for an epoxy (from reference [1])
Figure 4. Conductivity (ion viscosity = 1/conductivity) vs. glass transition temperature for a carbon fiber-epoxy composite (from reference [2])
Figure 5. Resistivity (ion viscosity) vs. sound speed for a curing epoxy-fiberglass prepreg (from reference [3])
Of course, every material is different and users should always confirm correlations of ion viscosity with a material’s other properties. Your mileage may vary. Nevertheless, dielectric cure monitoring (DEA) joins other thermal analysis techniques like differential scanning calorimetry (DSC) and dynamic mechanical analysis (DMA) as a valuable tool for studying curing thermosets and composites.
References
- J. Simpson and S. Bidstrup, “Rheological and Dielectric Changes During Isothermal Epoxy-Amine Cure,” J. of Polymer Science Part B: Polymer Physics, vol. 33, issue 1, pp 55-62 (1.1995)
- J.H. Chen, M.A. Octeau, M. Hojjati and A. Yousefpour, “Cure Cycle Optimization for Composite Panels Fabricated by RTM Using Dielectric Sensors,” National Research Council Canada, Institute for Aerospace Research, ICCM International Conferences on Composite Materials (2009)
- D. Shepard and K. Smith, “Ultrasonic Cure Monitoring of Advanced Composites,” Sensor Review, vol. 19 Issue: 3, pp. 187-194 (1999)
For further information on dielectric cure monitoring, please contact Lambient Technologies.


Leave a Reply