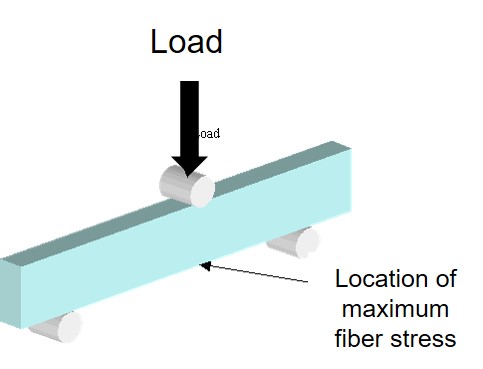
 The last post described the experimental procedure for the heat deflection temperature (HDT). A lot of technical data sheets show the HDT to aid in the material selection process. The HDT represents the upper use temperature for a particular polymer, formulation or composite. Recall from the last post that the HDT is defined as the temperature at which a standard dimension sample bar (ASTM D648) deflects by 0.25 mm in three point bending (see above) under a flexural load of either 0.455 MPa (66 psi) or 1.82 MPa (264 psi). An interesting question is how is the HDT related to the glass transition temperature (Tg)? The answer is it depends on the sample being tested.
Unfilled polymers will have a HDT value depending on whether it is amorphous or crystalline. The same polymer with fillers will have a different HDT depending on filler loading, filler orientation, and filler orientation with regards to the applied load.
A nice reference examining the influence of fillers on the HDT is given in Takemori (1).
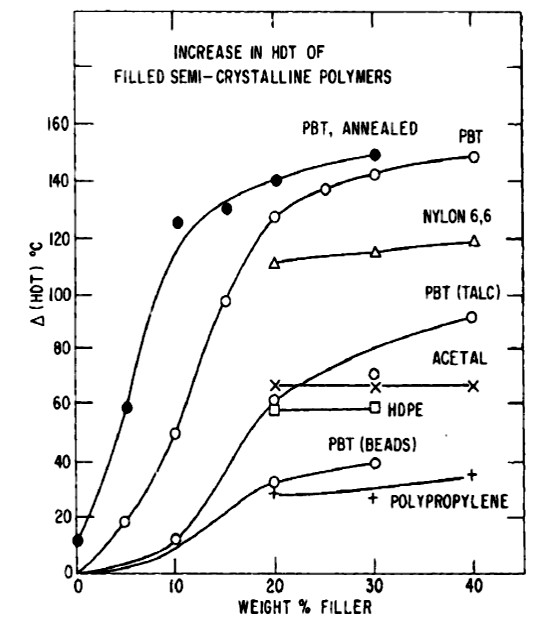
Figure 1. Increase in HDT for some filled semi-crystalline polymers (filler is glass fiber, except where noted. Beads are glass beads) from ref. 1.
In Figure 1 from Takemori’s paper, the HDT increases significantly for some semi-crystalline polymers such as PBT (polybutylene terephthalate) and does not change dramatically in others. In the case of PBT, the type of filler also plays in important role in that glass fibers increase the HDT more than talc and glass beads. Additionally, there is a saturation effect in that at higher filler loadings the HDT does not increase substantially (see acetal, HDPT, nylon 6,6, and polypropylene in Figure 1). Recall that semi-crystalline polymers both a crystalline domain and an amorphous region, the degree of crystallinity will also impact the HDT.
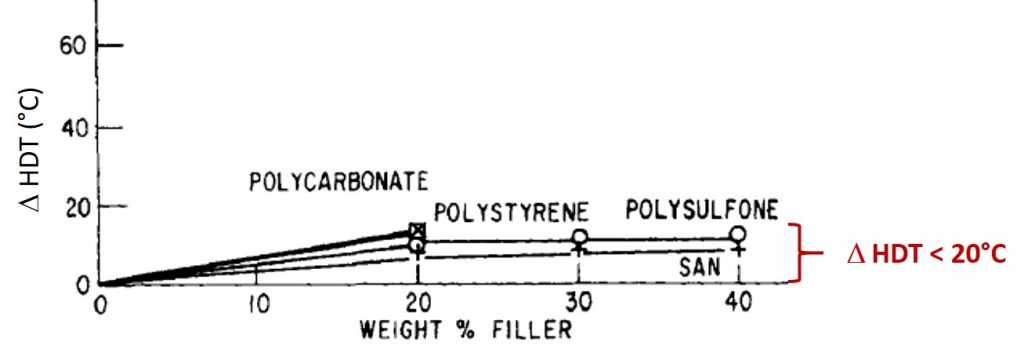
In the case of amorphous polymers, the change in the HDT with filler loading is much less pronounced. In Figure 2, the change in HDT is shown as a function of filler loading for amorphous polymers.
Figure 2. Increase in HDT for glass fiber filled amorphous polymers (ref. 1)
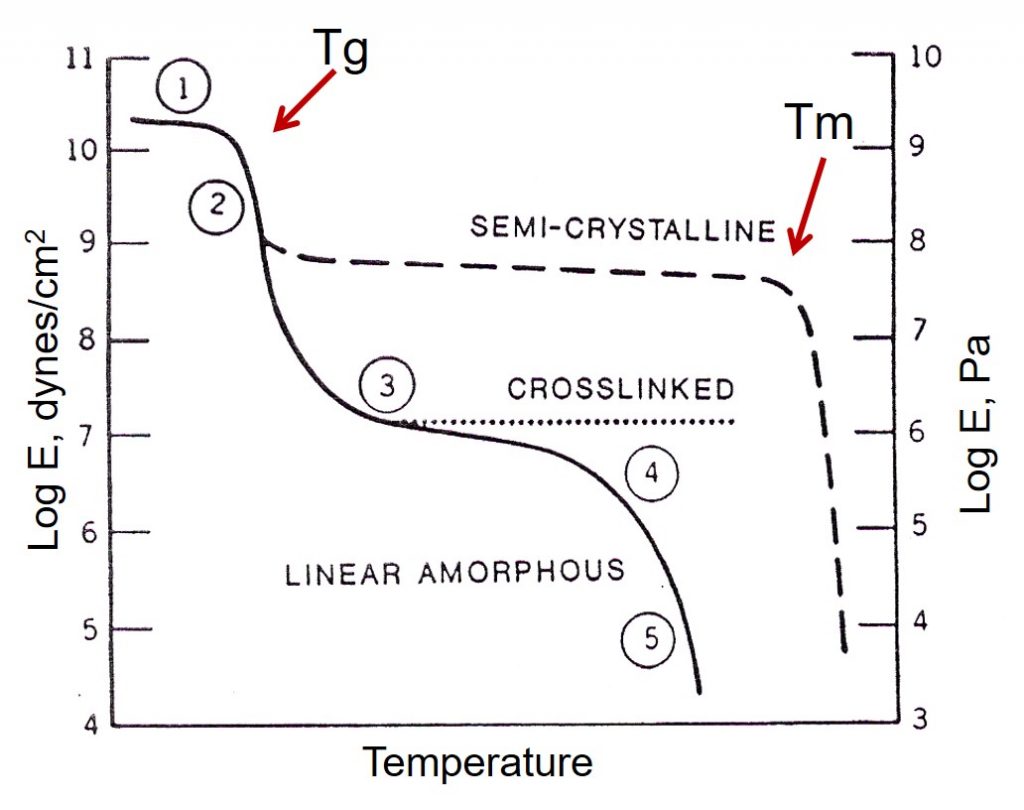
Note that the change in the HDT is less than 20°C for all of the amorphous polymers in Figure 2. For amorphous polymers the Tg is the only transition that impacts the modulus value. Below the Tg, an amorphous polymer is in the glassy region. The modulus drops precipitously at the glass transition temperature in amorphous polymers. For amorphous polymers, the HDT is below the Tg. It is instructive to look at the modulus temperature relationship for amorphous and semi-crystalline polymers as shown in Figure 3.
Figure 3. Schematic of the dynamic modulus, E’ as a function of temperature for an amorphous, crosslinked thermoset, and a semi-crystalline polymer.
As seen in Figure 3, for a linear amorphous polymer, there is a large drop in the modulus as the temperature increases from region 1 (glassy modulus) to region 3 (rubbery modulus). The softening and hence the deflection in the HDT is largely controlled by the glass transition of the polymer matrix. In the case of the crosslinked thermoset in Figure 3, there is also a very large modulus drop at Tg, but there is a plateau due to the crosslinked network in the rubbery region. For both linear amorphous polymers and crosslinked thermosets (i.e. epoxies), the HDT will be below the glass transition temperature.
For semi-crystalline polymers, the HDT is more complicated. In Figure 3, the dashed curve for the semi-crystalline polymer exhibits both a glass transition temperature (Tg) and a melting point (Tm). In the case of a semi-crystalline polymer, the melting point is caused by the melting of the crystalline domains and the Tg is attributed to the change in modulus in the amorphous region. Depending on the degree of crystallinity, the modulus decrease between region 1 and region 2 will change. Higher crystallinity will result in a higher plateau modulus owing to the increased contribution of the crystalline domains to the modulus. As shown in Figure 1, fillers in semi-crystalline polymers will also increase the HDT.
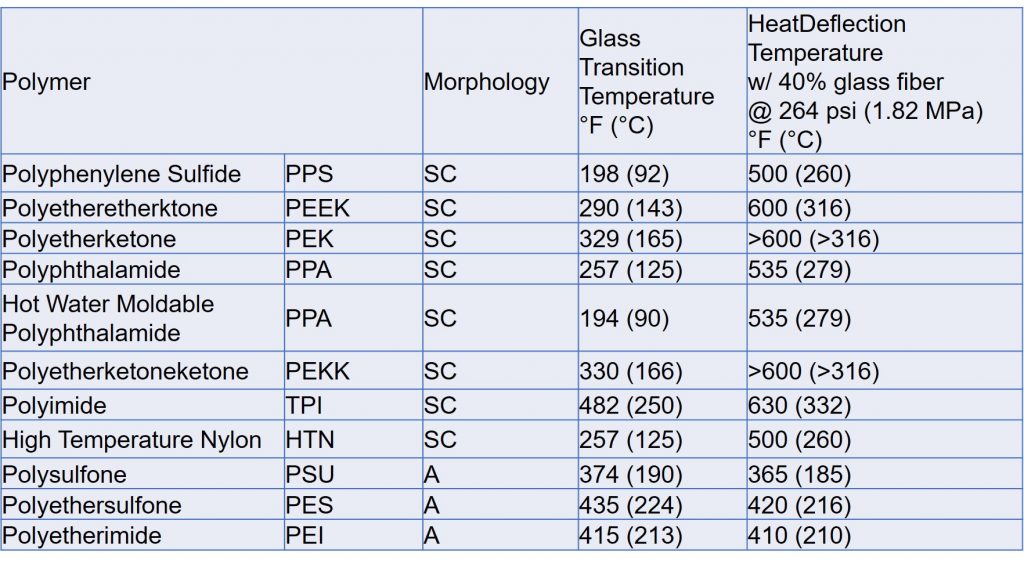
In the following table (from RTP Company) the glass transition temperature, continuous use temperature and the HDT are shown for various semi-crystalline (SC) polymers and amorphous (A) high performance polymers.
First let’s look at the amorphous polymers. For amorphous polymers, the HDT is slightly below the Tg as can be seen for polysulfone, polyethersulfone and polyetherimides in the table. For the semi-crystalline polymers the HDT is somewhere between the Tg and the Tm. In contrast with the amorphous polymers, the HDT is significantly higher than the Tg and is due to the crystalline regions providing high stiffness above the Tg. So be careful. The HDT and Tg cannot be used interchangeably as some do on technical data sheets.
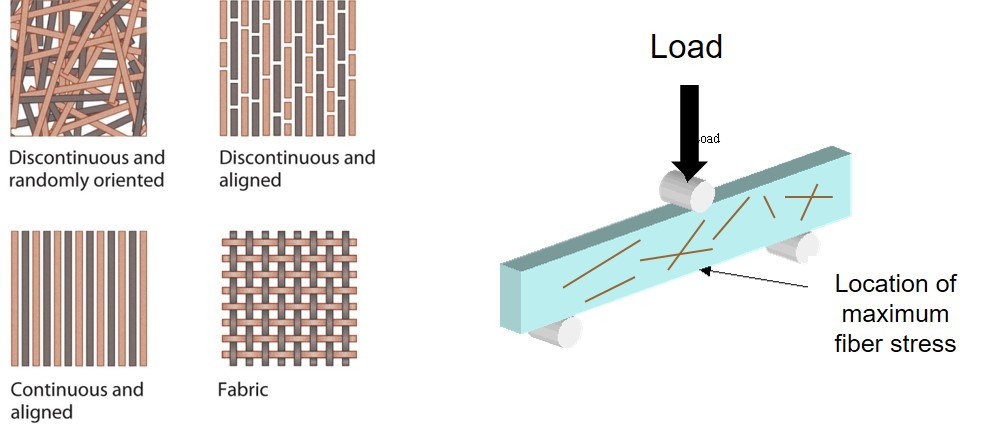
Figure 4. Schematic of HDT load application and typical types of reinforcements
One final note is that for fiber reinforced composites, fiber orientation with respect to the loading direction will also play an important role in governing the HDT. As seen in Figure 4, randomly oriented fibers will have one stiffness whereas uni-axially aligned fibers perpendicular to the loading direction will have a very different impact on the HDT. Woven fabrics will also have an impact on the HDT depending on weave geometry and orientation with respect to the loading axis.
A couple take-aways:
- Tg and HDT are not to be used interchangeably, especially in semi-crystalline polymers
- Tg measured by DSC, TMA, and DMA are typically higher than the HDT of amorphous polymers and thermosets
- HDT is influenced by the filler loading, filler type, and reinforcement geometry (woven fabric, random fibers, and particulates)
For those readers wanting a more detailed description of the relationship of HDT to Tg and Tm in semi-crystalline polymers is encouraged to read Takemori’s article.
References
- Michael Takemori, Towards an Understanding of the Heat Distortion Temperature of Thermoplastics, Polymer Engineering and Science, Vol. 19, no. 15, p. 1104, 1979

Leave a Reply