In the last post we described the experimental set-up to be able to measure the glass transition temperature and degree of cure during aborted rheometer runs. In this post we will present some experimental data as a case study.
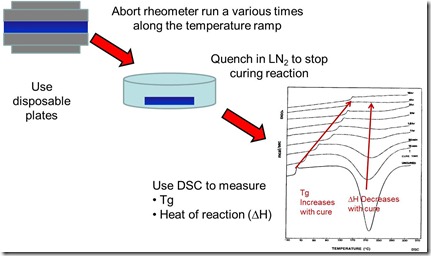
To correlate the conversion, Tg, and viscosity during non isothermal during, the rheometer runs were aborted at specified time intervals, the samples were quenched and analyzed by DSC. The following schematic shows the process to obtain the DSC samples during the rheometer run (1).
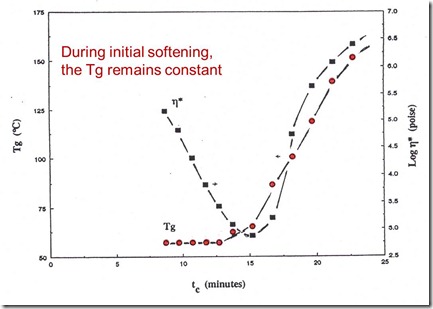
In the following figure, the Tg and complex viscosity are plotted as a function of time for a sample heating rate of 9.8oC/min. During the initial softening, the viscosity decreased by approximately 2 orders of magnitude as a result of the strong temperature dependence. Although there was a large decrease in the viscosity, the Tg remained constant during the early portion of the curing. As the temperature continued to rise, the onset of rapid crosslinking caused a sharp increase in Tg, with a concurrent increase in the viscosity.
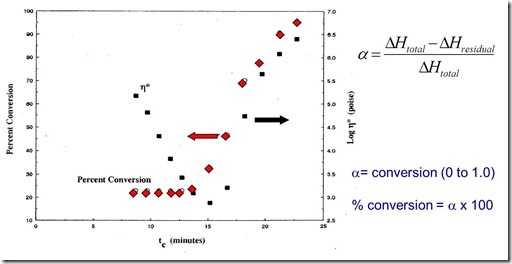
In the next figure, the complex viscosity and conversion are plotted as a function of curing time for a sample heating rate of 9.8oC/min. The initial conversion by DSC was 0.23 (This was partially reacted prepreg powder having a B-stage conversion of 23%). The conversion did not change during the initial softening of the resin. When the viscosity approached the minimum value, the conversion begins to increase. Although the conversion starts to increase, the viscosity of the growing network is more strongly governed by the temperature dependence of the viscosity. For a short time, the viscosity continues to decrease while both the Tg and the conversion are increasing. After the minimum viscosity, the network formation (crosslinking reaction) causes a rapid increase in the viscosity.
By combining the use of both rheometry and thermal analysis methods, the relationship between the viscosity and the degree of cure could be carefully determined.
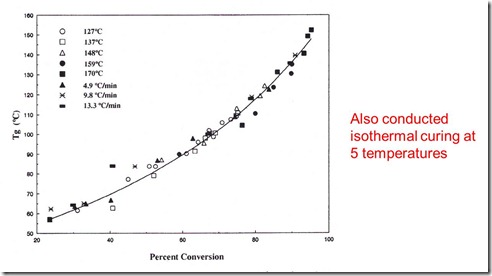
One might be curious about the relationship between the glass transition temperature (Tg) and the conversion. Using the above data and some additional Tg/conversion data obtained from isothermal curing studies, a universal relationship between Tg and conversion can be demonstrated. In the following figure, Tg is plotted as a function of DSC degree of conversion.
Both the isothermal and non-isothermal curing data fall onto a single line in agreement with modeling studies using model epoxy networks (2).
In the next post we will focus on measuring the viscosity and the dielectric response during curing.
References:
1. B. Fuller, J. Gotro, and G. Martin, Advances in Chemistry Series, #227, p. 215, American Chemical Society (1990)
2. Venditti and Gillham, J. Appl. Polym. Sci. 64, 3 (1997)


Leave a Reply