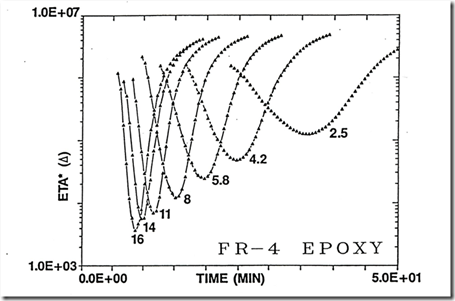
During the lamination of B-staged prepregs to make printed circuit boards, the partially cured resin-impregnated glass cloth is subjected to a nonisothermal temperature profile. This causes the resin to flow over the circuit traces and chemically react forming an intractable fully cured network. The viscosity profile determines the flow window, or time when the resin is flowing. In the following figure, the complex viscosity is plotted as a function of time for a series of heating rates to a cure temperature of 175oC. The resin system was a bis-maleimide traizine epoxy blend (1). As the temperature increases, the resin softens at the Tg of the partially cured polymer. With continued heating, the viscosity dramatically decreases. When the chemical kinetics of the crosslinking reactions are faster than the decrease in the viscosity, the viscosity reaches a minimum and subsequently increases. The curing reactions continue, the molecular weight and crosslink density increase, causing the viscosity to increase.
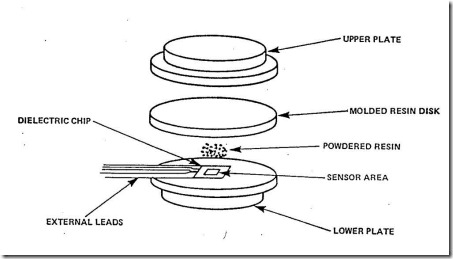
To obtain a direct correlation of the dielectric loss factor to physical changes in the resin during the curing cycle, the dielectric loss factor was measured using the embedded dielectric sensor method. The following figure shows the microdielectric sensor mounted in the lower parallel plate in the rheometer (2):
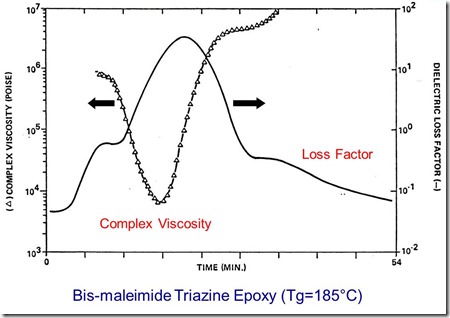
In the following figure, the loss factor and complex viscosity are plotted as a function of time for a 5.8oC/min. heating rate to 175oC.
This first inflection in the loss factor data corresponds to a frequency dependent dipolar relaxation (2) which occurs as the resin softens at the glass transition temperature. With continued heating, ionic conductivity begins to dominate the loss factor, with a large rise in the loss factor. The viscosity reaches a minimum value and begins to increase due to decreased segmental mobility as the crosslinking reaction increases the molecular weight. As the segmental mobility of the network decreases with crosslinking, the loss factor decreases. The resin continues to react (decrease in loss factor and increase in viscosity) at the final cure temperature until vitrification occurs, resulting in the appearance of a dipole peak and a sudden upturn in the viscosity. The vitrification event was clearly evident in the viscosity data. The rheometer oven was maintained at 175oC and data acquisition continued for a total of about 50 minutes. At about 30 minutes, the viscosity increased rapidly resulting in an input overload and the rheometer stopped taking oscillatory data, however the dielectric data acquisition continued. The diffuse shoulder on the dielectric loss factor peak at long times occurred at approximately the same time as the rapid upturn in the viscosity. The appearance of dipole peaks during isothermal curing at temperatures below the ultimate Tg has been observed previously (3,4).
References
1) “Characterization of a Bis-Maleimide Triazine Resin for Multilayer Circuit Boards,” with B. Appelt, IBM Journal of Research and Development, v. 31, p. 616 (1988).
2) “Simultaneous Dielectric and Dynamic Mechanical Analysis of Thermosetting Polymer,” J.T. Gotro and M. Yandrasits, Polymer Engineering and Science, v. 29, p. 278 (1989)
3) S. Senturia and N. Sheppard, Advances in Polymer Science, V. 80, p. 1 (1986).
4) N. Sheppard, Ph.D Thesis, Massachusetts Institute of Technology, Cambridge, MA 1986.


Leave a Reply