Guest post by Jeremy Pasatta, Advanced Polymer Coatings
Now that we have looked at the theory of toughening thermosets with second phase tougheners along with the two most common tougheners (RLP and coreshell particles) let’s look at how we measure the toughness of thermosets. There are several different methods to measure the toughness of thermosets, and the method that is chosen often depends on the type of thermoset, the application, and exactly how the thermoset is being used withing the application. Table 1 gives an overview of the different ways of measuring thermoset toughness for different applications along with the ASTM or ISO standard method.
Table 1. Methods for Measuring Toughness of Thermosets
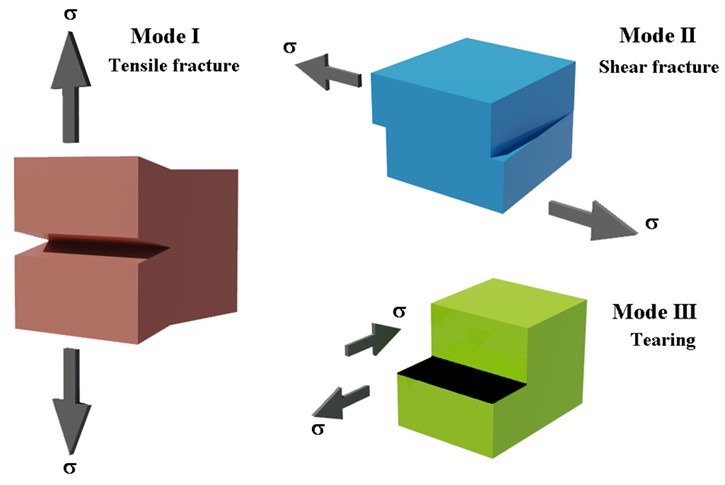
Fracture toughness can be measured in different modes including tensile fracture, shear fracture and tearing fractures, but for thermosets the most common mode is Mode 1, or tensile fracture, because this is often how most thermosets will fail and a convenient method for measuring samples in the lab. An overview of the different modes is shown in Figure 1.
Figure 1. Fracture Toughness Modes (from ref [1])
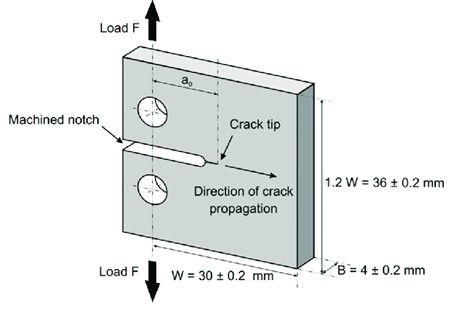
The two most common units for representing the fracture toughness of a neat thermoset are K1C and G1C, which are the plain strain fracture toughness and the fracture energy respectively. Typically, a rectangular specimen of neat thermoset is machined with a notch and two holes for loading into a Universal Tester. In the machined notch, a crack is usually initiated with a nitrogen cooled razor blade, and the sample is pulled apart under Mode I at a defined rate with the energy required to maintain stable crack growth measured. A typical example of machined neat thermoset for fracture toughness is shown in Figure 2.
Figure 2. Typical Neat Thermoset Fracture Toughness Specimens (from ref [2])
A study was conducted comparing coreshell resins to CTBN on their effectiveness to toughen a standard bisphenol A epoxy cured with methylhexhydropthalic anhydride [3]. The coreshell resins tested are summarized in Table 2. The CTBN used as comparison is listed in Table 3 and was a standard CTBN containing 18% acrylonitrile.
Table 2. Coreshell Resins Tested for Toughening
K1C and G1C were determined using ISO 13586 with single-edge notch bend (SENB) specimens and the results are given in Table 3 at a comparative loading of 9% toughener.
Table 3. Kc and Gc Results for Coreshell and CTBN Tougheners
The data in Table 3 indicates that at a 9% loading level, the toughened samples with CTBN (at 18% acrylonitrile) achieved the highest K1C and G1C values, although the CTBN it did depress the Tg more than the coreshell samples. As noted in previous blog posts, a CTBN that does not phase separate will remain dissolved in the matrix resin and depress the Tg. This study does show how much coreshell and CTBN tougheners can improve the fracture toughness and additionally presents a model for the fracture toughness behavior of the coreshell resins.
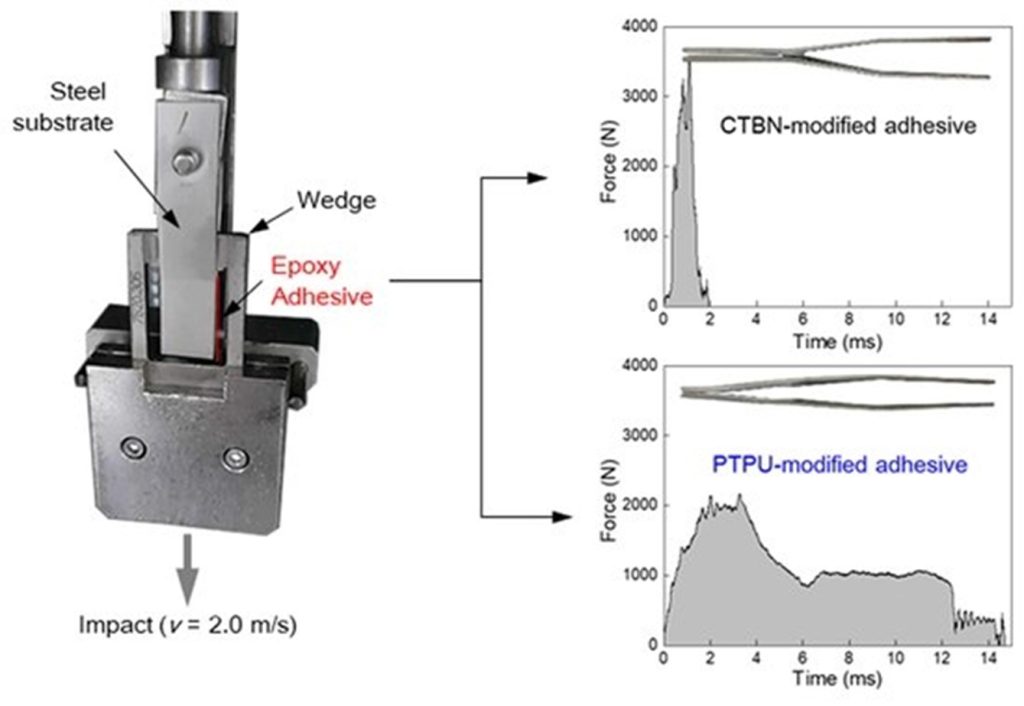
The speed at which fracture toughness is tested can also have different effects for different tougheners. Automotive structural adhesives typically need to withstand impact at high rates of speed, which is why the impact wedge peel test, ISO 11343 was developed. In this test, typically done at temperatures as low as -40˚C, a wedge is drawn through two adherends at high rate of speed. For this type of high impact event, CTBN often is not enough to toughen because the particle cavitation will not be able to respond to the rate of testing, and other tougheners such as phenol terminated polyurethanes are used. A comparison of the structure of phenol terminated polyurethanes and CTBN is given in Figure 3.
Figure 3. Chemical Structure of Phenol Terminated Polyurethane and CTBN (from ref [4])
When tested at various concentrations, the phenol terminated polyurethane gave stable crack growth with a high energy to maintain that crack growth, while the CTBN gave a brittle fracture. It should be noted though that the phenol terminated polyurethane significantly decreased the Tg of the epoxy system, more so than the CTBN, and also greatly increased the viscosity of the system. Figure 4 shows not only the set-up of the impact wedge peel test but also the difference in the brittle fracture of the CTBN modified sample versus the stable crack growth of the phenol terminated polyurethane sample.
Figure 4. Impact Wedge Peel Testing of CTBN vs. Phenol Terminated PU (from ref [4])
Now that we have looked at the need for tougheners, the two most common tougheners, RLP and coreshell, along with some common methods for measuring toughness and typical results, the next set of blog posts will cover some of the less commonly used types of tougheners along with some current topics and challenges with thermoset toughening.
References
- Rocha-Rangel, Enrique. ‘Fracture Toughness Determinations by Means of Indentation Fracture’. Nanocomposites with Unique Properties and Applications in Medicine and Industry, InTech, 23 Aug. 2011. Crossref, doi:10.5772/18127.
- Bajpai, Ankur & Martin, R. & Faria, H & Ibarboure, E. & Carlotti, Stephane. (2020). Epoxy based hybrid nanocomposites: Fracture mechanisms, tensile properties and electrical properties. Materials today: proceedings. 10.1016/j.matpr.2020.02.797.
- Giannakopoulos, G. & Masania, Kunal & Taylor, Ambrose. (2011). Toughening of epoxy using core–shell particles. Journal of Materials Science – J MATER SCI. 46. 327-338. 10.1007/s10853-010-4816-6.
- Polymers2020, 12(7), 1549; https://doi.org/10.3390/polym12071549


Leave a Reply