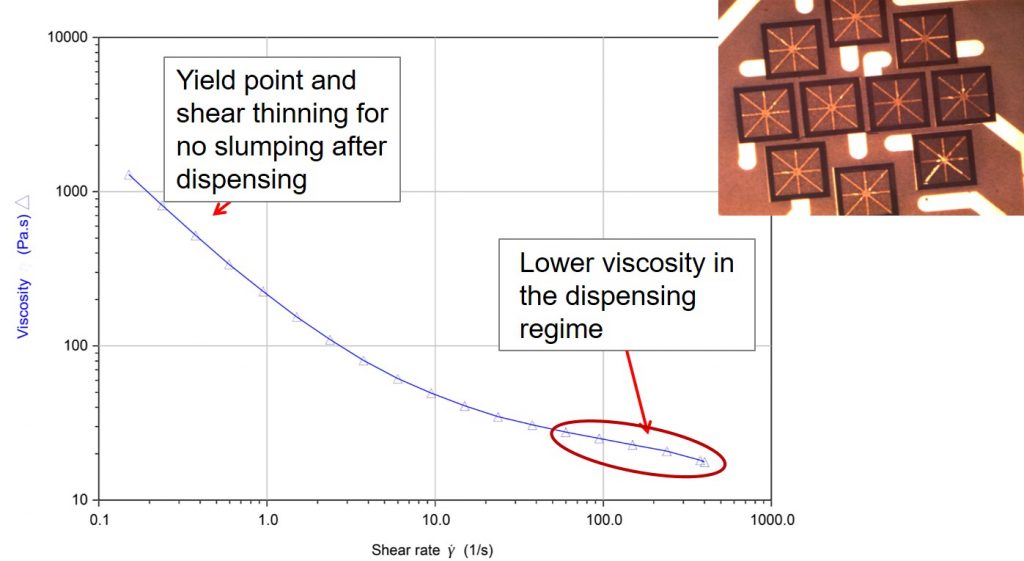
The last post introduced the concept of using fumed silica as a rheology modifier to tailor the dispensing of many types of adhesives used in electronic applications. In the image in the top right in the figure above shows a die attach adhesives dispensed on a PBGA substrate. After dispensing, the adhesives retain the “snowflake” or “asterisk” dispensing pattern. The viscosity shear rate curve above is for an epoxy resin modified with a fumed silica.
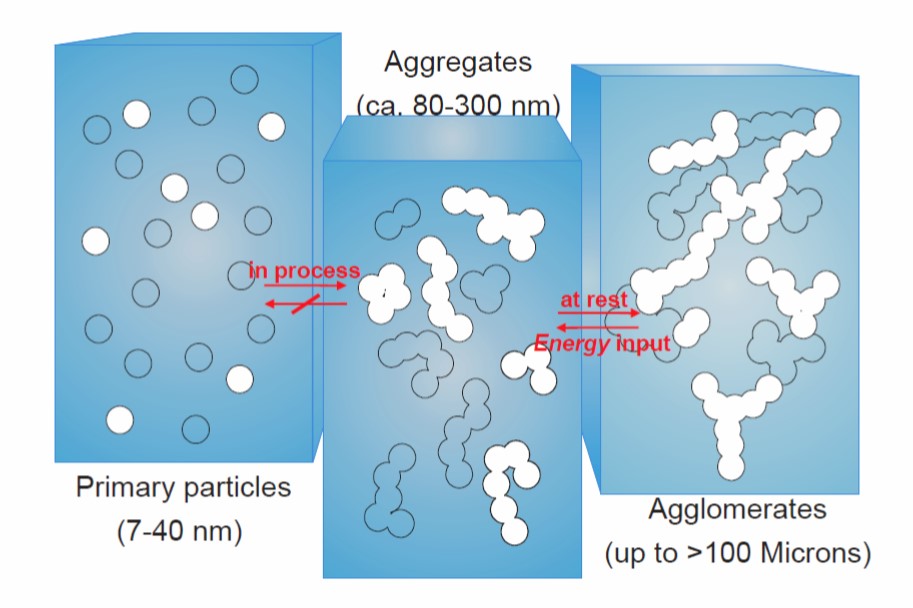
Let’s turn our discussion to the mechanism of how fumed silica impacts the rheological properties of filled thermoset systems. Fumed silica (or fumed silicon dioxide) is produced by high temperature hydrolysis of silicon tetrachloride in an oxygen and hydrogen atmosphere [1]. The resulting primary particles are in the size range of 7-40 nm as shown schematically in Figure 1.
Figure 1. Schematic of the morphology of fumed silica at different process stages (reference [1])
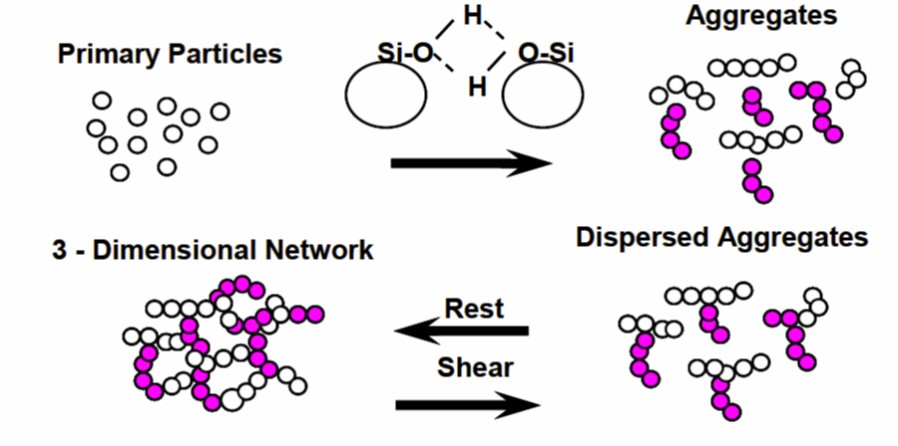
The particles from the flame hydrolysis form aggregates in the size range of 80-300 nm). As shown in Figure 1, the aggregation to intermediate size is largely non-reversible. Without shear forces, due to strong interparticle attractive forces, fumed silica will agglomerate to form a network structure that could exceed 100 microns as shown schematically on the right in Figure1. In the agglomerated form, a three dimensional network is formed. Shear will break down the network structure resulting in a lower viscosity (see Polymer Innovation Blog). The key to the efficacy of fumed silica as a rheology modifier is the ability of the agglomerates to break down in a shear field and subsequently re-agglomerate at rest. Figure 2 is a schematic representation of the fumed silica particles at various stages.
Figure 2. Schematic of particle-particle interactions in fumed silica (reference [1])
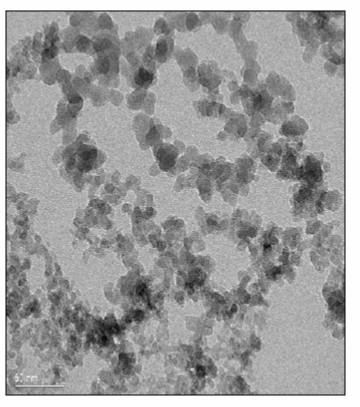
As seen on the top in Figure 2, strong particle-particle attraction, in this case hydrogen bonding between the surface hydroxyl groups leads to aggregates. The aggregates can then form three dimensional networks that are added to the resin system. Now comes the good part. The 3-dimensional fumed silica networks cause a large increase in the viscosity at rest. During shearing, the 3-dimensional network is broken down resulting in dispersed aggregates. As we have seen in previous posts, as the particle networks break down, the viscosity decreases dramatically in what is termed shear thinning. During high shearing rates, such as during dispensing, the viscosity is low allowing for accurate placement of the adhesive. Once the shear forces are removed, i.e. when the asterisk pattern is placed, at rest, the fumed silica dispersed aggregates can re-form the 3-dimensional network. Figure 3 is an electron micrograph of a fumed silica 3-dimensional network.
Figure 3. Electron micrograph of fumed silica network structure (reference [1])
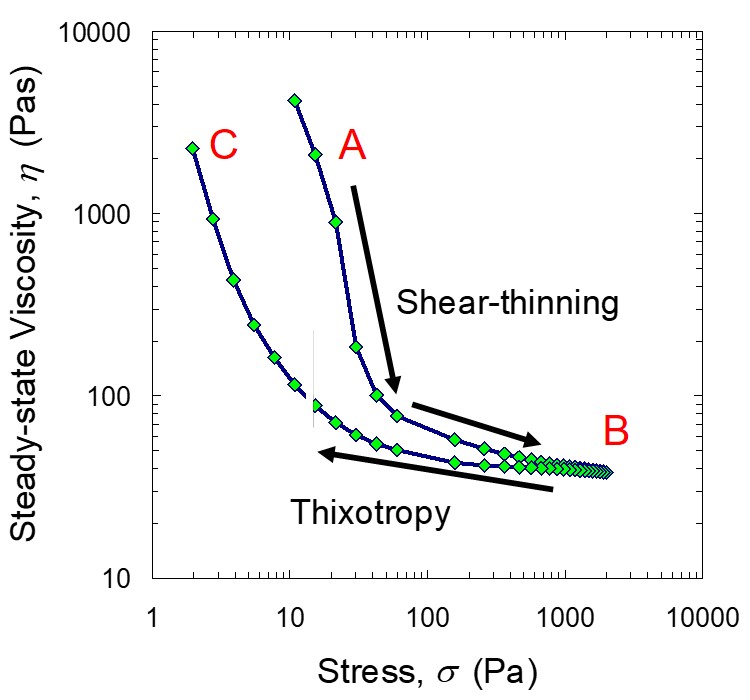
Let’s explore the viscosity shear stress relationship for a fumed silica filled epoxy resin. Figure 4 shows the viscosity as a function of shear stress during a controlled stress sweep ((see Polymer Innovation Blog).
Figure 4. Viscosity as a function of shear stress for a fumed silica filled epoxy resin.
In Figure 4, the starting viscosity at point A is high indicating a large influence of the agglomerated fillers forming the 3-dimensional network. In this case the resin only viscosity was on the order of 20 Pas. As the shear stress increases, the shearing fields begin to break down the particle agglomerates resulting in a decrease in the viscosity. The shear stress was incrementally increased until point B (indicated by the two arrows above the top viscosity curve). Near point B, the viscosity does not appreciably change with incremental increases in the shear stress, possibly indicating the fumed silica has been broken down to the dispersed aggregates and potentially some dispersed particles.
After the shear stress reached point B, the shear stress ramp was reversed (as shown in the direction of the arrow below the lower viscosity curve). From point B to C, the shear stress was incrementally decreased. The shear stress was decreased until approximately 2 Pa. There are a couple of interesting features to note in the decreasing shear stress ramp. As the shear stress decreases, at the high shear stresses, the viscosity during the recovery is pretty similar to the top curve. As the shear stress decreases, the deviation of the lower curve becomes more pronounced. Additionally, one notes that the yield stress (the approximate stress at point C) is about 2 Pa whereas the initial yield stress was approximately 10 Pa.
The next post will discuss in more detail the concepts of thixotropy and shear thinning.
References:
- James Toth, Rodney Conn, and Anthony Gosselin, Evonik Degussa Corp. Thermoset Resin Formulators Association in San Antonio, Texas September 13 – 14, 2010

Leave a Reply