The last post described the controlled stress experiment. In the image above, a stress was applied to the sample and the deformation as a function of time (strain-rate) was measured at steady state. There are two measurement modes for controlled stress curves:
- Manual: a series of creep measurements (which was used above)
- Automatic: Flow or viscometry mode in a controlled stress rheometer which performs creep tests automatically, but will lead to artifacts if the measurement time per point is too short.
Many of the commercial stress rheometers can be programmed to apply a torque and a wait time before measurement can be added to the program (flow or viscometry mode). Using this mode requires careful experiments (especially in the low stress region where the deformation and deformation rate is very small). The user is advised to use caution in using the automatic mode since unless the deformation rate reaches steady state, errors in the viscosity will occur.
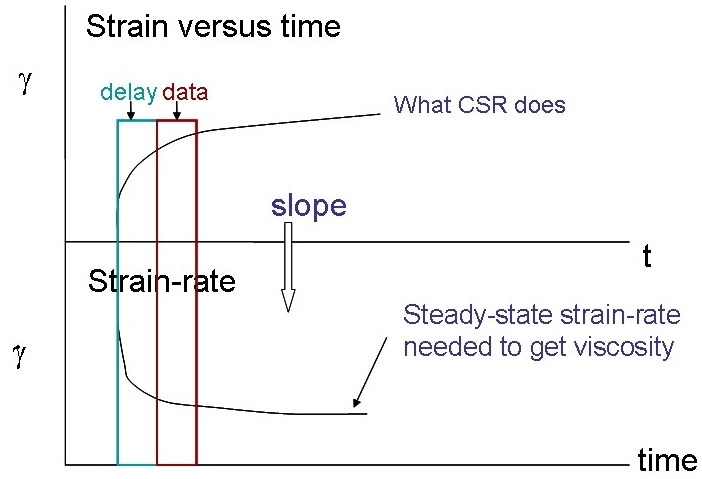
Figure 1. Deformation (strain) and strain-rate as a function of time in a controlled stress experiment when the measurement time is set too short.
Figure 1 shows the impact of not properly setting the delay time in a controlled stress experiment. If the delay is too short and the deformation and thus the deformation rate has not reached steady state, the slope of the shear-rate versus time will not have reached a level value, giving rise to an erroneous viscosity value. At low stresses, the time to reach equilibrium could be fairly long thus making the series of controlled stress experiments tedious. If you want good yield point data, resist the urge to use the automated flow mode in your rheometer. The data in Figure 2 shows a series of controlled stress flow curves measured in various modes.
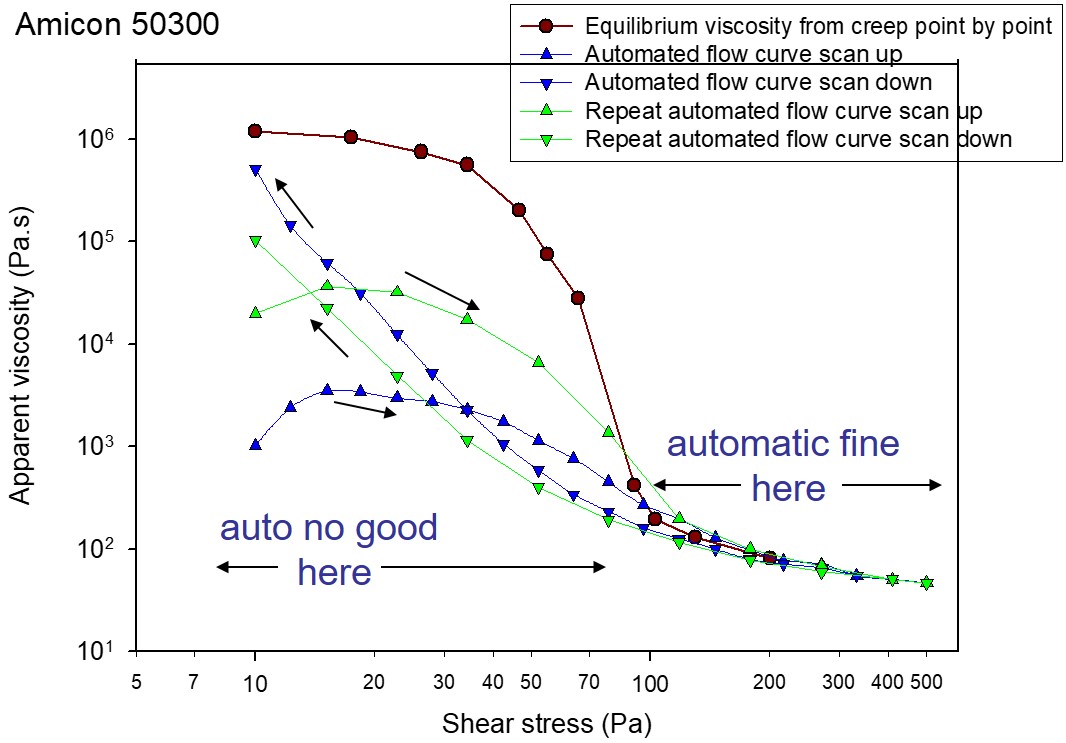
Figure 2. Apparent viscosity as a function of shear stress for a highly filled adhesive (Amicon 50300), from Buscall and Murray [1].
The red curve (top curve in Figure 2) shows the equilibrium viscosity obtained from a creep experiment from point-to-point. The red curve is the true viscosity shear-stress relationship. The blue curves show the flow curves measured in automated flow. The lower blue curve shows the automated flow curve (scan up indicated by the arrow, that is increasing shear stress) and the upper blue curve represents the automatic flow sweep (scan down, at decreasing shear stress). Note that until about a shear stress of 100 Pa, there is a large difference in the viscosity. As the structure rebuilds during the downward stress sweep, note that the viscosity builds to a value closer to the equilibrium viscosity. The green curves represent another automated stress curve taken right after the first automated stress curve (both up and down). The same trends on the viscosity shear stress relationships are observed. The viscosity on the repeat automated flow curve (green curve, scan up) is much lower than the equilibrium viscosity and only matches the equilibrium viscosity at approximately 100 Pa. The green repeat automated flow curve scan down again shows the structure rebuilding at decreasing shear stresses. Note that the viscosity does not build to the equilibrium viscosity and the repeated shearing appears to prevent the structure build-up (particle-particle interactions) from occurring. Each progressive shearing and then recovering experiment leads to a different viscosity stress curve. Note that all of the curves overlap at stresses greater than 100 Pa for this material. If you are going to use automated flow curves, one must do a careful point-by-point creep curve to establish the equilibrium viscosity profile.
Amicon 50300 is a one-part epoxy-based encapsulant with a filler loading of 65-71 wt% depending on the viscosity grade selected [2].
References:
- Buscall and M. Murray private communication
- Amicon 50300 Series Technical Data Sheet
Leave a Reply